AI Mentions
Ahrefs Free AI Visibility Checker: What You Get, Limitations & Alternatives
Yes, Ahrefs has a free AI Visibility Checker. You can enter a brand name, inspect its presence across six AI search experiences, and see…
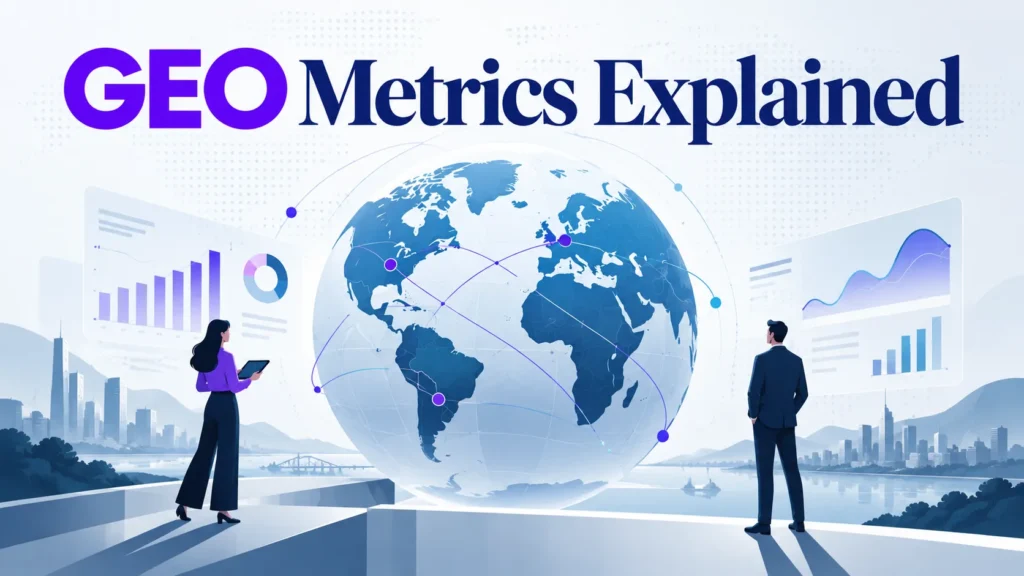
Generative Engine Optimization (GEO) makes a brand more likely to be cited in AI-generated answers. This guide sets out a three-layer scorecard for geo metrics: citations, share of voice and prompt coverage. Read all three together, since referral traffic understates visibility and citation counts can overstate it.
Report prompt coverage to leadership first, as it shows how much buyer research you reach. Citation frequency and share of voice then explain the result.
Generative Engine Optimization (GEO) is the practice of making a brand, product or page more likely to be selected, cited and recommended inside AI-generated answers. Geo metrics count how often a brand appears across a defined set of prompts, not where a page ranks, and teams in marketing services use that count to judge visibility.
Traditional SEO dashboards miss this because answer engines have no reliable rank position, and many answers are consumed without a click.
AI visibility should be measured as a share of answers. As buyers move shortlisting research into tools like ChatGPT, Google AI Overviews and Perplexity, that share decides whether a brand is in the conversation at all.
Zero-click answers never produce a visit, so referral data undercounts AI influence. Answers are also non-deterministic, so sample a fixed set of queries on a schedule and compare results over time, using the same resources each cycle and logging findings on a blog or internal sign-off page.
Three numbers carry most of the weight in any GEO metrics programme. Working professionals and teams can use these geometrics to judge visibility across AI search support, services and information resources.
AI citation frequency is the share of sampled answers that cite your domain:
Citation frequency = citations ÷ total responses sampled, per engine and per prompt cluster.
Run it per engine, since ChatGPT, Google AI Overviews, Perplexity, Gemini and Microsoft Copilot draw on different sources. Illustratively, 46 citations in 200 ChatGPT responses gives 23%.
Share of voice measures your slice of the competitive conversation:
Share of voice = your citations ÷ total citations for all brands in the same prompt set.
Define the competitive set before you start.
Prompt coverage is the percentage of tracked prompts where your brand appears at least once. Check which queries your site answers and where contact points or latest resources could strengthen the mention.
Branded search lift is a downstream signal. Track branded query volume in Google Search Console alongside your visibility trend.
On one 200-prompt set, the brand is cited in 46 answers (23%) but earns only 9 referral visits from AI domains. Citations and referrals diverge, so use your own ratio where you have it.
Measuring GEO performance is a repeatable cycle. Citation frequency, share of voice and prompt coverage only compare well month to month if the prompt set and sampling cadence stay fixed, and a generative engine’s answers can shift from one sample to the next.
Prompt-based measurement is a sample, not a census, so treat small changes with caution. Pair this monitoring with Google Search Console data for the latest view of search demand.
Create an analytics channel group that isolates referrals from AI domains such as chatgpt.com and perplexity.ai, and tag your own links with UTM parameters. Treat this data as a floor, since many AI answers are consumed without a click.
Three tool categories exist: dedicated AI visibility platforms (faster but costly), manual logging (free but slow), and analytics configuration (cheap but blind to zero-click answers). For a shortlist, see our best geo tools for beginners guide.
| Symptom | Likely cause | Next action |
|---|---|---|
| Low citation frequency | Content lacks direct, quotable answers | Rewrite key sections as self-contained definitions |
| Low share of voice | Competitors are cited more often | Audit competitor sources and close content gaps |
| High impressions, no referrals | Answers resolve without a click | Track citations and branded search lift instead |
Read the three metrics together. Each combination points to a different action.
Thresholds are illustrative until you have your own baseline. After three months, set targets such as a coverage floor for core prompt clusters.
Track citation frequency, prompt coverage and branded search lift first. Start with at least 100 prompts, since smaller sets give unstable percentages. Marketing teams can also track how often AI results cite their site compared with rivals’ services pages.
AI visibility is best measured as a share of answers across a defined prompt set, not as a single traffic figure. Referral data captures only surviving clicks, so it understates citations.
Your next step is to write 100 buyer prompts and log the first sample from ChatGPT and Google AI Overviews this week.
GEO metrics measure how often and how prominently a brand appears in AI-generated answers, through citation frequency, share of voice and prompt coverage.
Divide responses citing your domain by total responses sampled, per engine and per prompt cluster. For example, 30 citations across 200 responses gives 15 percent. Sample each prompt more than once, since answers vary.

Tom is the CEO of MediaOne, a leading digital marketing agency. He is a business-experienced SEO consultant as well as a Google Gold Search Expert serving the international community. He has consulted for MNCs like Canon, Maybank, Capitaland, SingTel, ST Engineering, WWF, Cambridge University, as well as Government organisations like Enterprise Singapore, Ministry of Law, National Galleries, NTUC, e2i, SingHealth. His articles are published and referenced in CNA, Straits Times, MoneyFM, Financial Times, Yahoo! Finance, Hubspot, Zendesk, CIO Advisor. Under his stewardship, MediaOne has won dozens of prestigious digital marketing awards.
Run a free Digimetrics audit across SEO, AI search, content and technical health, and get a plan you can act on today.
Start free →Yes, Ahrefs has a free AI Visibility Checker. You can enter a brand name, inspect its presence across six AI search experiences, and see…
Your website ranks on Google. Your SEO dashboard shows healthy organic traffic, and your brand appears for several commercially valuable keywords. But when someone…
Direct answer: To rank in Perplexity and ChatGPT, answer one narrow question clearly, make each claim easy to check, and structure the page so…