AI Mentions
Ahrefs Free AI Visibility Checker: What You Get, Limitations & Alternatives
Yes, Ahrefs has a free AI Visibility Checker. You can enter a brand name, inspect its presence across six AI search experiences, and see…
Your keyword research tool says a phrase receives 10,000 searches per month.
You rank in the top three. The keyword difficulty is manageable, the search intent matches your article, and your reporting spreadsheet predicts a few thousand monthly visitors.
Six months later, you’re still ranking, but the traffic never arrives.
The obvious explanation used to be that your ranking wasn’t strong enough, or that the keyword volume estimate was wrong. Both are possible, but there’s another explanation that deserves more attention in 2026.
People are still searching. They’re just not necessarily clicking.
Google increasingly answers questions directly through featured snippets, knowledge panels, AI Overviews, and AI Mode. Other AI search products also allow users to explore topics without following every source back to its original website.
That changes the economics of keyword research.
Search volume was never a guarantee of traffic. It was an estimate of demand that SEO teams could combine with ranking positions and expected click-through rates (CTR) to forecast website visits.
The demand hasn’t necessarily disappeared. The relationship between demand, visibility, and clicks has become less predictable.
And the change is uneven.
A search asking for a simple definition may be satisfied entirely within the results page. Someone comparing enterprise software, investigating a technical problem, or evaluating a significant purchase may still need detailed information beyond a generated summary.
But even those more complex searches aren’t immune to AI-generated answers.
The solution isn’t to abandon keyword research or replace every informational article with a comparison.
It’s to stop treating every search as though it has the same probability of producing a website visit.
This guide explains what has changed, what current research actually shows, and how to rebuild keyword forecasts around search intent, observed CTR, AI exposure, and business value.
We’ll also show how to measure whether the revised approach is working without relying on arbitrary AI-related traffic multipliers.
Traditional keyword research follows a familiar process.
You discover a relevant keyword, examine its search volume and difficulty, estimate the ranking position you can achieve, and calculate the traffic that position might generate.
For example, a keyword with 10,000 monthly searches might be assigned an expected CTR of 15%.
Under that assumption, a ranking page could receive approximately 1,500 monthly clicks.
The arithmetic is straightforward.
The problem is whether that CTR assumption remains appropriate.
A traditional organic result competes for attention with other organic listings, advertisements, shopping features, videos, local results, and increasingly AI-generated information.
The same ranking position may produce very different click behavior across two queries.
Before blaming AI, it’s worth understanding what keyword volume actually measures.
Google Keyword Planner describes average monthly searches as the average number of searches for a keyword and its close variants over the selected period, location, and search network.
It also notes that historical search-volume statistics are rounded.
Third-party SEO platforms use their own databases and estimation methods, so their figures may differ.
Consequently, a reported search volume of 10,000 shouldn’t be interpreted as exactly 10,000 distinct people making the same query every month.
Nor does it mean that 10,000 potential visits are available to one website.
Source: Google Ads — About Keyword Planner Forecasts.
The estimate remains useful for comparing relative demand. But it needs additional context before being converted into an organic traffic target.
A simplified traditional model looks like this:
Expected organic clicks = Monthly search volume × Expected organic CTR
That approach can still provide a rough planning estimate, provided the CTR is appropriate for the query and the expected ranking position.
The problem occurs when the same historical CTR curve is applied across an entire keyword portfolio.
An article explaining a basic concept, a product comparison, and a branded product query may have similar search volumes but completely different click opportunities.
A ranking position alone no longer describes enough of the search results page to make a reliable forecast.
This is why SEO teams need to recalibrate their assumptions against observed search behavior.
The argument that AI-generated answers affect website traffic isn’t based entirely on speculation.
Two major studies provide useful evidence, although their methods and conclusions need careful interpretation.
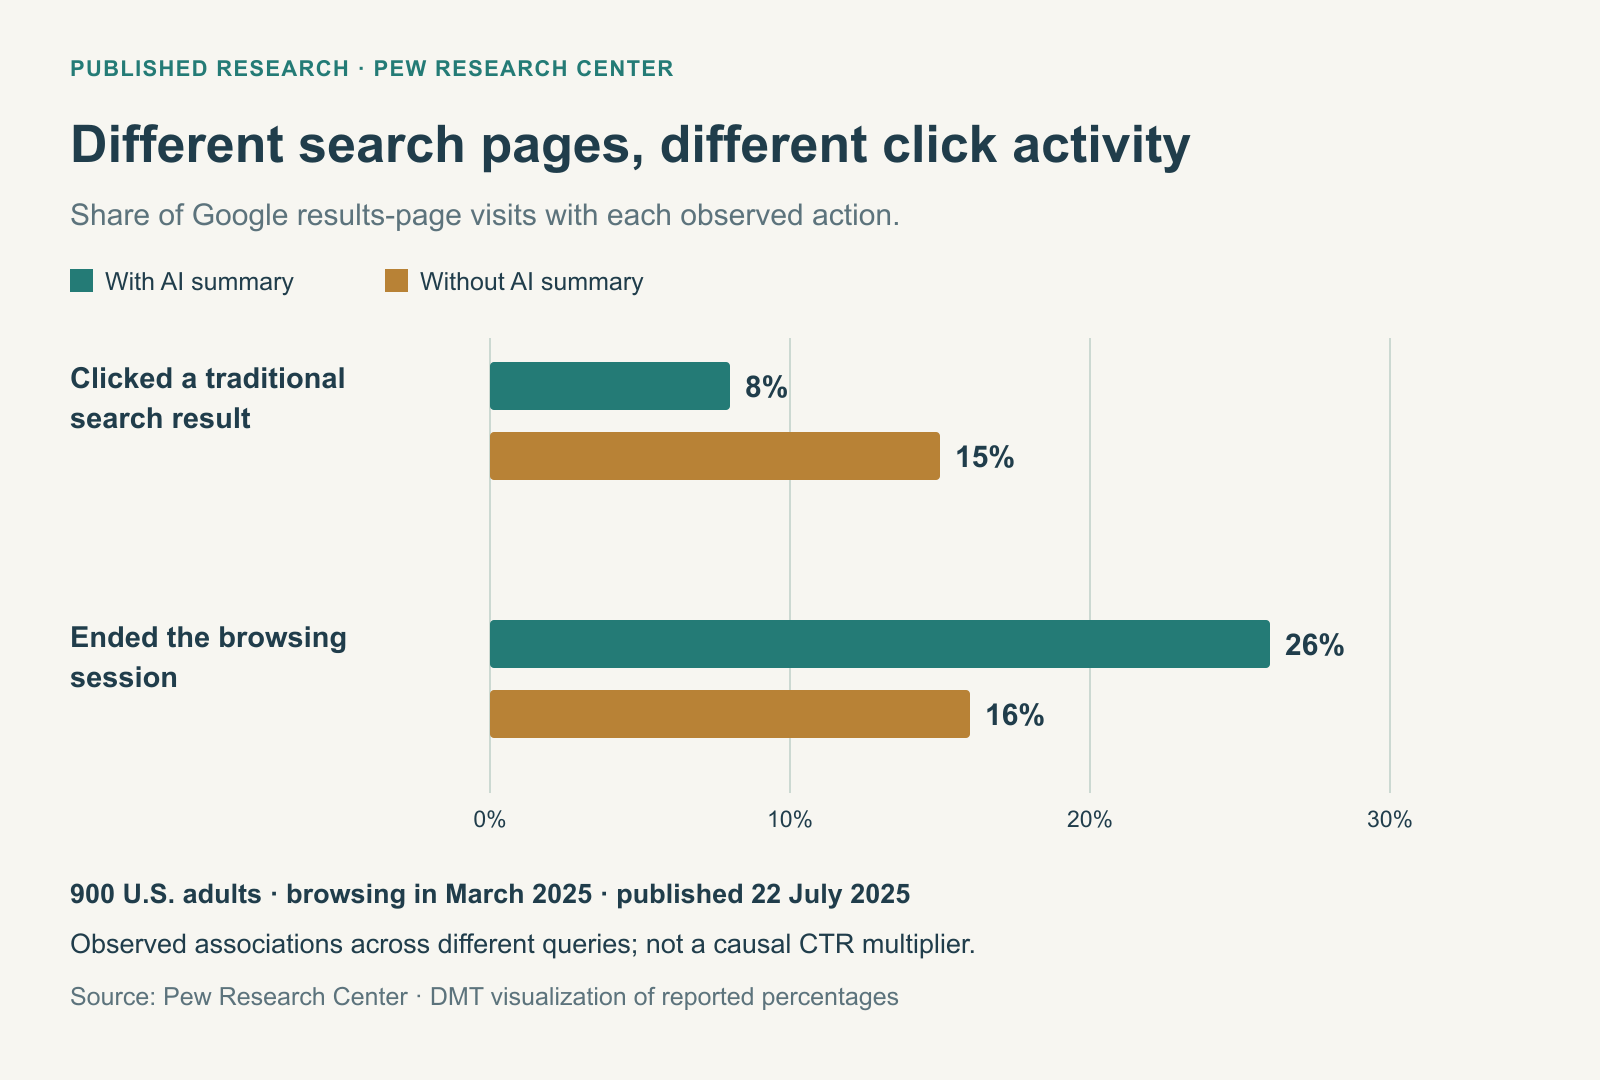
In July 2025, Pew Research Center published an analysis of Google search behavior based on browsing activity from 900 U.S. adults.
The researchers examined searches conducted during March 2025 and compared what happened when an AI-generated summary appeared with searches where one did not.
Their findings included:
| Observed Behavior | With AI Summary | Without AI Summary |
|---|---|---|
| Clicked a traditional search result | 8% | 15% |
| Ended browsing session | 26% | 16% |
Pew also found that users clicked links directly within AI summaries in approximately 1% of visits to results pages featuring those summaries.
Source: Pew Research Center — Google Users Are Less Likely to Click on Links When an AI Summary Appears.
The findings suggest that searches displaying AI-generated summaries are associated with lower click activity.
However, the study doesn’t prove that adding an AI Overview to any individual keyword reduces its CTR by a fixed percentage.
Queries that trigger AI summaries may already differ from queries that don’t, including their length and informational purpose.
The researchers also analyzed a particular period, population, and set of Google experiences.
That makes the research valuable evidence of changing behavior, not a universal forecast adjustment.
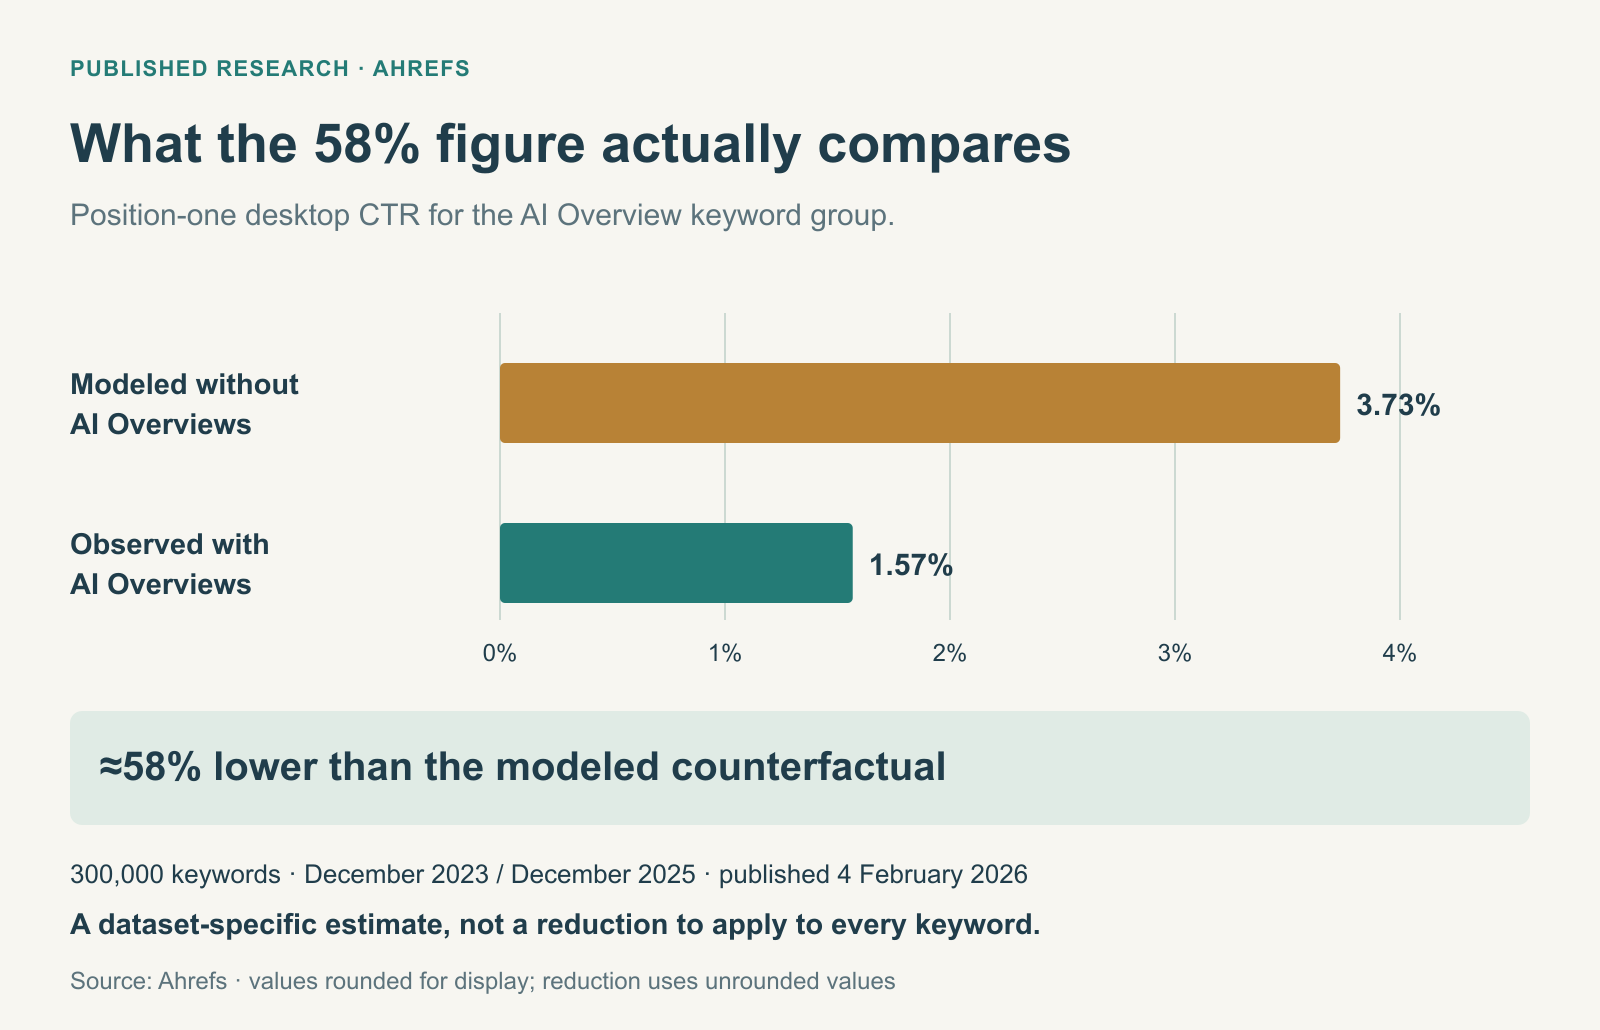
Ahrefs published an updated analysis in February 2026 examining organic CTR for informational keywords associated with AI Overviews.
The study used 300,000 keywords, divided between keywords with and without AI Overviews, and compared aggregated Google Search Console data across periods before and after AI Overviews became common.
Ahrefs estimated that AI Overview presence was associated with an approximately 58% lower average CTR for the position-one organic result, relative to its modeled counterfactual.
Source: Ahrefs — Update: AI Overviews Reduce Clicks by 58%.
That’s a meaningful finding.
It also needs the right interpretation.
The 58% figure is not the percentage of all Google searches lost to AI. It isn’t a measured traffic decline for every website, and it shouldn’t be copied into a forecast as a universal adjustment.
The research concerns a defined dataset, a top-ranking position, particular search intents, and a model comparing observed CTR with an estimated alternative.
The important conclusion isn’t that everyone should reduce their forecasts by 58%. It’s that historical CTR assumptions can substantially overstate traffic potential for some AI-affected queries.
Google argues that AI-powered Search experiences can help users discover more sources and that visitors arriving through AI Overviews may be more engaged.
Its official documentation continues to emphasize established SEO practices, useful content, and technical accessibility.
These positions aren’t necessarily mutually exclusive.
A search experience could produce fewer clicks on some types of queries while sending more engaged visitors on others.
That’s why the most useful evidence for your own forecast is still your website’s observed performance, supported by external research rather than replaced by it.
Source: Google Search Central — AI Features and Your Website.
The practical response is to classify keywords according to what users need from the result.
Not every search represents the same opportunity to attract a visitor.
I’d separate the keyword portfolio into four main groups, with a fifth flag for the presence of AI-generated answers.
| Keyword Segment | Example | Expected Click Behavior | Recommended Approach |
|---|---|---|---|
| Simple factual or definitional | “what is bounce rate” | Higher risk of users getting answers without clicking | Conservative traffic forecasts; focus on differentiation |
| Comparative or evaluative | “Ahrefs vs Semrush for agencies” | Users may seek details, evidence, pricing, and alternatives | Prioritize original comparisons and decision support |
| Transactional or navigational | “buy accounting software Singapore” | Stronger potential for action, but SERP competition remains important | Evaluate conversion value and search features |
| Specific long-tail | “why is GA4 showing duplicate purchase events” | Highly variable; some need detailed instructions | Use observed CTR and query-level evidence |
| AI-answer exposure flag | Any query that triggers AI Overviews | Potential change in traditional click behavior | Track separately and recalibrate expectations |
These are forecasting hypotheses, not guaranteed rules.
A long-tail question can be answered immediately by an AI Overview. A comparison can be summarized by AI Mode. A transactional query may face advertisements and shopping features that reduce traditional organic clicks.
Intent helps organize expectations, but the live search results determine the actual environment.
Consider a search such as “what is a meta description.”
A concise explanation may satisfy the user’s immediate need.
If Google presents an accurate answer directly, the searcher may have little reason to visit another page offering essentially the same definition.
That doesn’t make every definitional article worthless.
A definition can introduce a broader topic, support internal links, build topical coverage, or help readers who need a more detailed explanation.
However, creating hundreds of interchangeable definition articles purely because each keyword has high reported search volume is increasingly difficult to justify.
For these keywords, I’d use conservative click forecasts and ask whether the page provides value beyond the answer visible in the search results.
A search for “best SEO tools for small businesses” has a different purpose.
The user may need to understand pricing, limitations, integrations, ease of use, and how different products fit specific requirements.
An AI-generated summary can provide an initial shortlist, but users making consequential decisions may still seek detailed comparisons, firsthand evidence, and transparent methodologies.
That creates an opportunity for useful editorial content.
However, commercial intent alone doesn’t guarantee clicks.
Google AI Mode can also compare products, and other publishers may provide more compelling information than your article.
The defensible strategy is to create comparisons that help readers make decisions rather than publishing generic rankings.
Our guide to choosing a keyword research tool illustrates how practical criteria and repeatable evaluations can make a software guide more useful than a feature list.
Transactional searches often signal that users are closer to taking an action.
Someone searching for a specific product, booking service, or software subscription may need to reach a website to complete a purchase or inquiry.
Navigational searches also tend to contain a clear destination.
Nevertheless, saying these queries are unaffected by changes in search behavior would be inaccurate.
Advertisements, shopping results, local packs, and AI-powered product discovery can all influence the available organic clicks.
Branded navigational searches may have strong CTR but limited value for acquiring new customers who aren’t already familiar with the business.
Forecast these keywords based on observed CTR and business outcomes, not an assumption of immunity.
Long-tail keywords are especially difficult to classify using volume alone.
Some are simple factual questions. Others describe detailed problems that require tutorials, examples, screenshots, or troubleshooting.
For instance, “why does GA4 count purchases twice after checkout” may be more valuable than a broad definition of conversion tracking.
A useful answer could help the reader diagnose duplicate events, inspect tagging, and correct implementation problems.
But the keyword might also have low reported volume, making its traffic potential easy to underestimate.
Don’t automatically reject these topics because of small volume estimates.
Investigate whether the query represents a recurring, commercially relevant problem.
One tempting solution is to apply a fixed reduction to every keyword forecast.
For example, a team might decide that AI Overviews have reduced CTR and multiply every projected organic click figure by 0.6.
That produces a cleaner-looking spreadsheet.
It doesn’t produce a particularly defensible forecast.
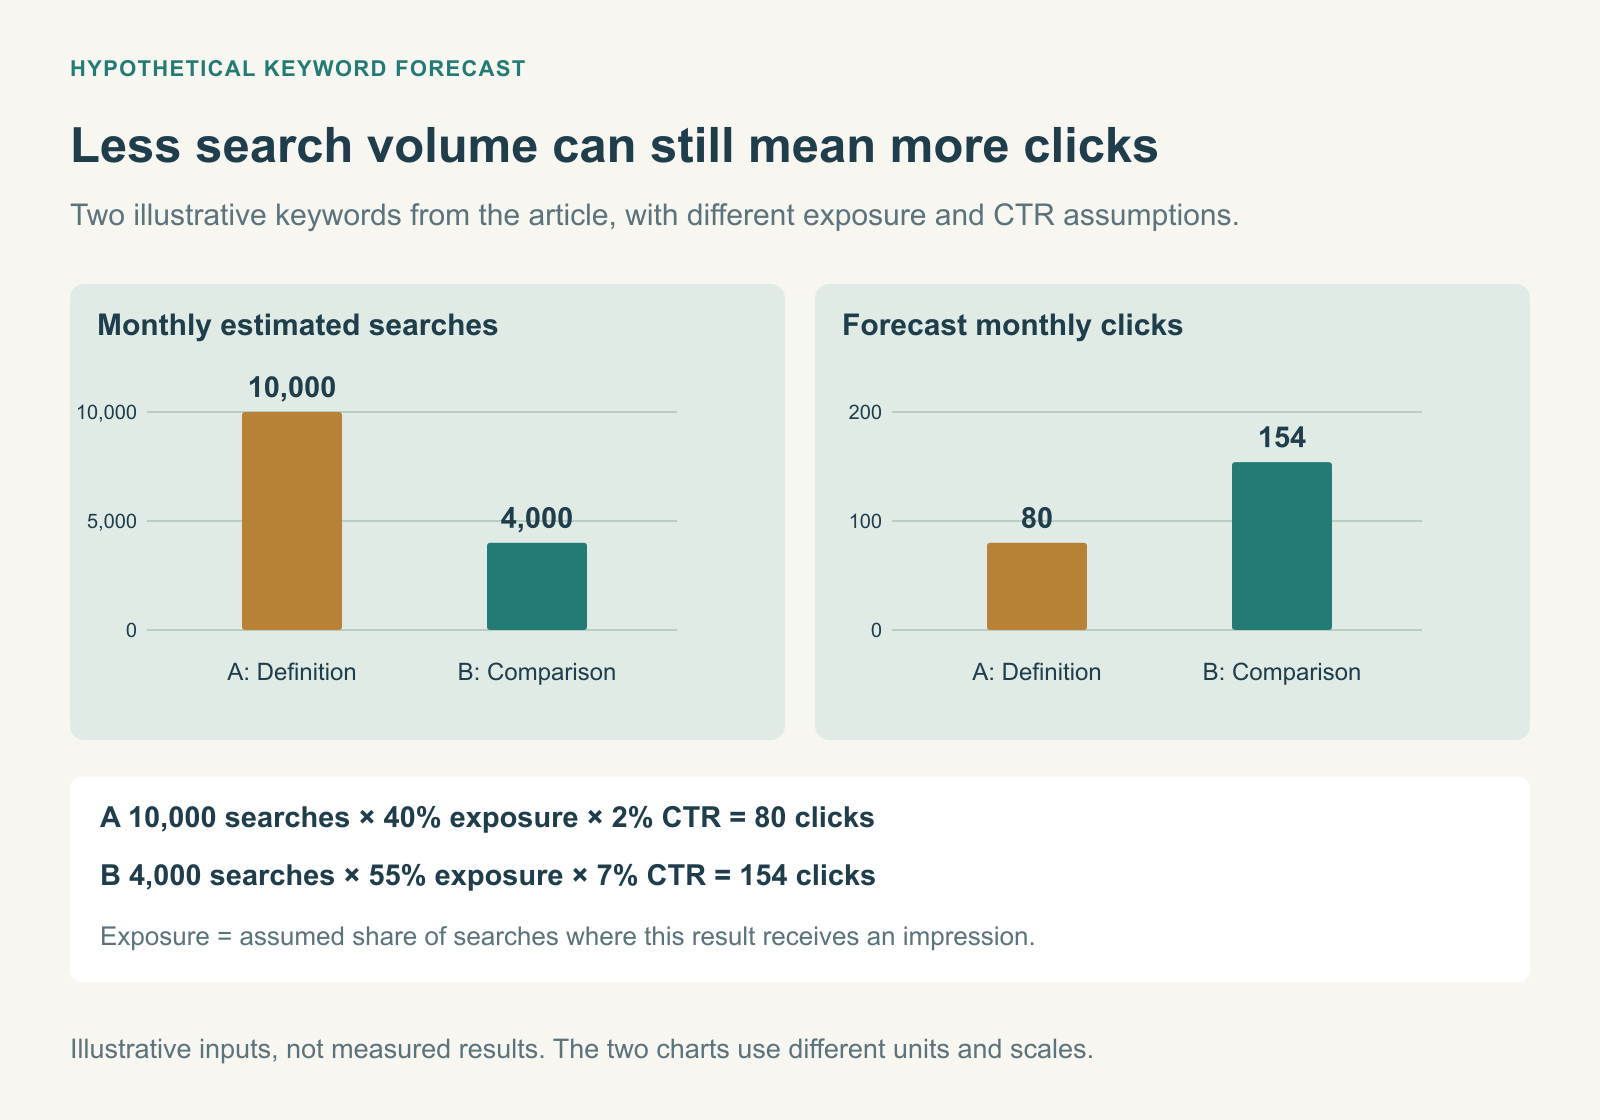
Consider two hypothetical keywords.
Both have meaningful demand, but their search environments differ.
| Factor | Keyword A: Simple Definition | Keyword B: Software Comparison |
|---|---|---|
| Monthly estimated searches | 10,000 | 4,000 |
| Assumed share of searches where your result receives an impression | 40% | 55% |
| Assumed CTR when shown | 2% | 7% |
| Forecast monthly clicks | 80 | 154 |
The calculation is:
Estimated clicks = Estimated searches × Expected impression share × Expected CTR
For Keyword A:
10,000 × 0.40 × 0.02 = 80 clicks
For Keyword B:
4,000 × 0.55 × 0.07 = 154 clicks
These are illustrative assumptions, not measured CTRs or vendor data.
The lower-volume keyword generates more expected clicks because the assumed visibility and click behavior are different.
That is the point.
Search volume describes only one part of the opportunity.
The forecast still depends on whether the website will be shown and whether someone who sees it has a reason to click.
For a new page, you also need to account for the uncertainty of achieving the assumed visibility in the first place.
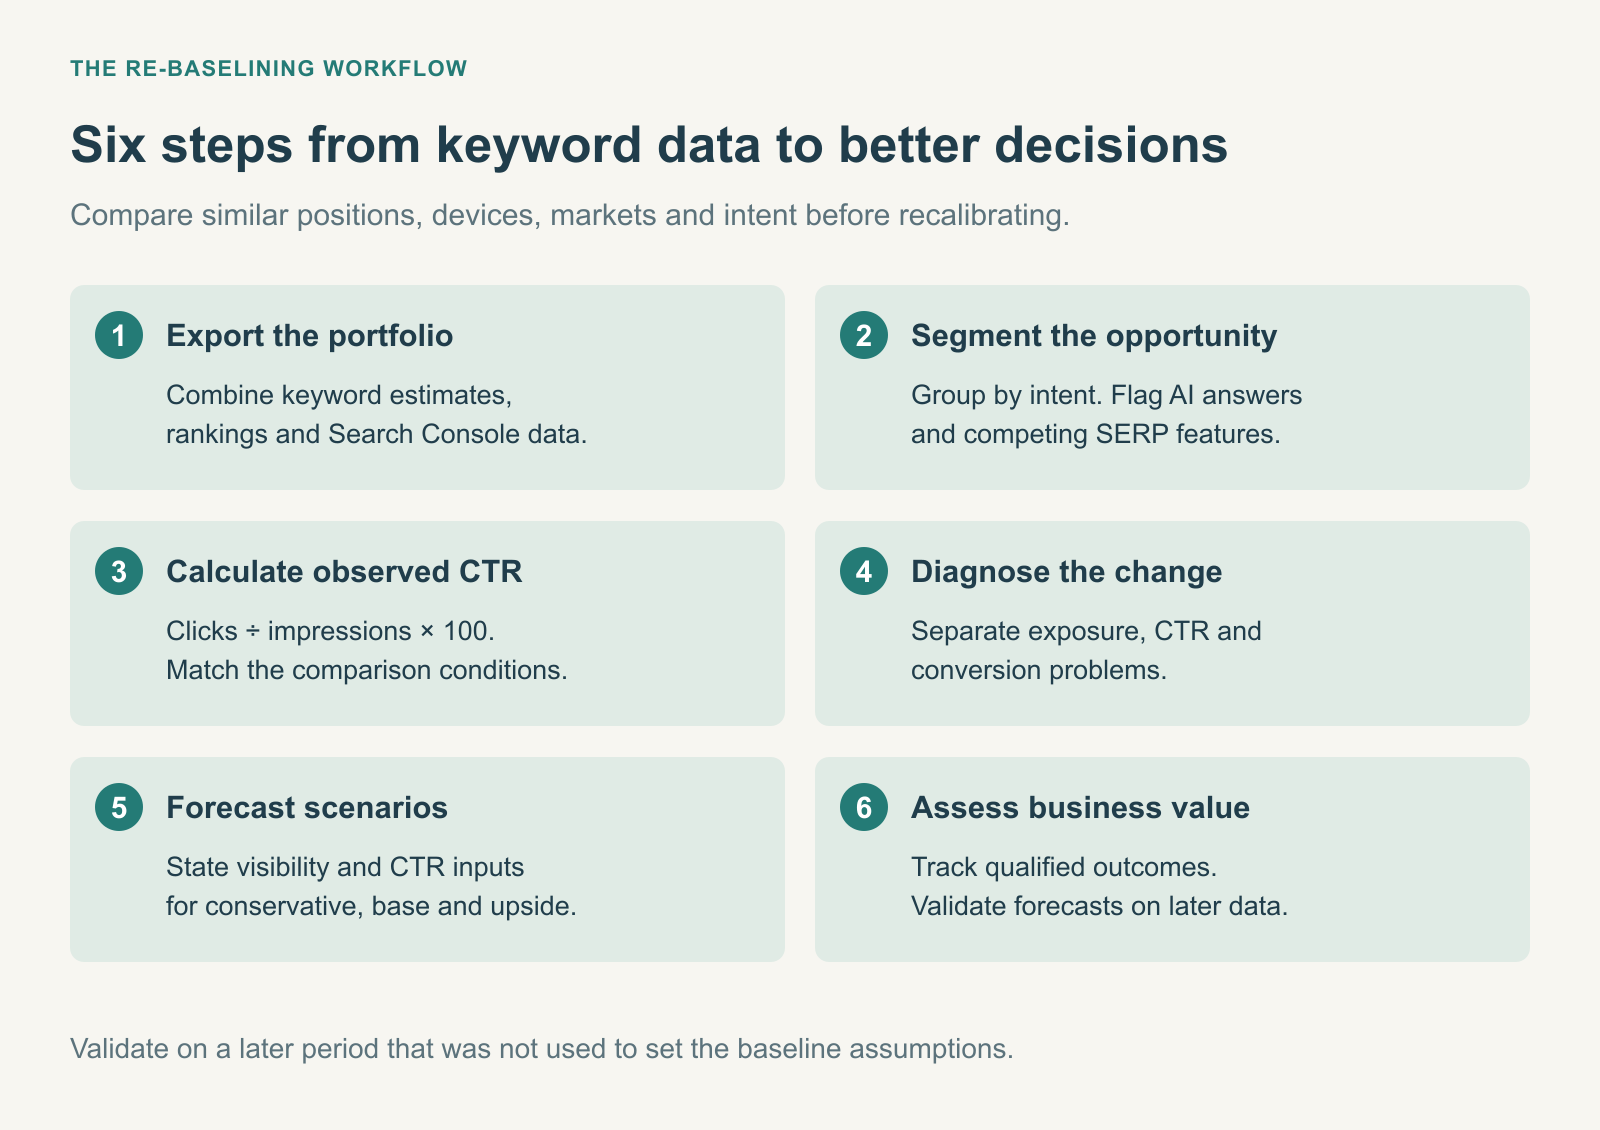
Re-baselining doesn’t mean abandoning existing keyword data.
It means using actual website performance to update the assumptions connecting demand, rankings, and visits.
Here’s the process I’d recommend for an SEO team managing an established content library.
Start with the keywords you’re currently tracking or targeting.
Collect available data from your keyword research platform, rank tracker, and Google Search Console.
At minimum, the working dataset should include:
| Field | Purpose |
|---|---|
| Keyword or query cluster | Groups related demand without unnecessary duplication |
| Estimated monthly search volume | Provides a directional demand estimate |
| Search intent | Identifies the user’s likely objective |
| Ranking URL | Associates demand with existing content |
| Ranking position | Provides visibility context |
| Search Console impressions | Shows actual observed Google exposure |
| Search Console clicks | Measures recorded search visits from Google |
| Observed CTR | Establishes a first-party click baseline |
| SERP features | Identifies AI Overviews and other competing results |
| Business relevance | Indicates whether the query supports valuable outcomes |
Don’t add together keyword volumes indiscriminately.
Closely related phrases may be grouped by the keyword provider or covered by the same page, making a naive sum misleading.
Use logical topic clusters and record the assumptions behind any combined demand estimate.
Next, classify the portfolio according to the type of answer the user needs.
The earlier four-segment framework provides a starting point.
Add a separate indicator for whether AI Overviews or other answer-generating features appear in the results for the target geography and device.
This is important because a query’s intent and the SERP it triggers are related but different variables.
For example, a commercial comparison might trigger an AI Overview on one day and not another.
If your rank tracking tool captures SERP features, review that historical data rather than relying on a one-time manual search.
Our guide to choosing a rank tracking tool explains why location, device, collection time, and SERP features matter when interpreting ranking data.
Use Google Search Console to establish how your own content performs.
For each relevant query group, calculate:
Observed CTR = Search Console clicks / Search Console impressions × 100
Then compare results across similar ranking positions, devices, geographies, and search intents.
For example, don’t compare the CTR of a mobile informational query averaging position eight with that of a desktop branded query averaging position one.
Those aren’t equivalent conditions.
The objective is to create a more relevant historical reference than a single industry-wide CTR curve.
Where enough data exists, inspect separate time periods to determine whether the relationship has changed.
However, remember that Search Console doesn’t reveal every individual query.
Google anonymizes certain rare searches, and report limits can omit rows even when the corresponding activity contributes to totals.
This is particularly relevant for long-tail content.
Source: Google Search Console — Understanding Performance Data Discrepancies.
Suppose an informational article loses 30% of its organic traffic.
Before blaming AI Overviews, examine what happened to its impressions, CTR, and rankings.
| Observation | Possible Explanation | Next Investigation |
|---|---|---|
| Impressions stable, CTR falling | Search behavior or SERP presentation changed | Review AI Overviews, ads, snippets, device mix, and query mix |
| Impressions and clicks both falling | Demand, ranking, or indexing may have changed | Review rankings, search demand, technical status, and seasonality |
| Rankings stable, clicks falling | Changes in CTR or actual exposure | Compare query/device segments and SERP layout |
| Impressions rising, clicks flat | Visibility increasing without equivalent clicks | Examine page intent, position mix, and AI exposure |
| Clicks stable, conversions falling | Traffic quality or conversion issues | Review landing pages, conversion tracking, and user behavior |
These patterns are diagnostic clues, not definitive explanations.
A stable average ranking position can conceal changes in which queries produce impressions. Similarly, a falling CTR may reflect increased visibility for lower-ranking keywords rather than a direct deterioration in existing performance.
The correct investigation uses multiple metrics rather than treating any single number as proof.
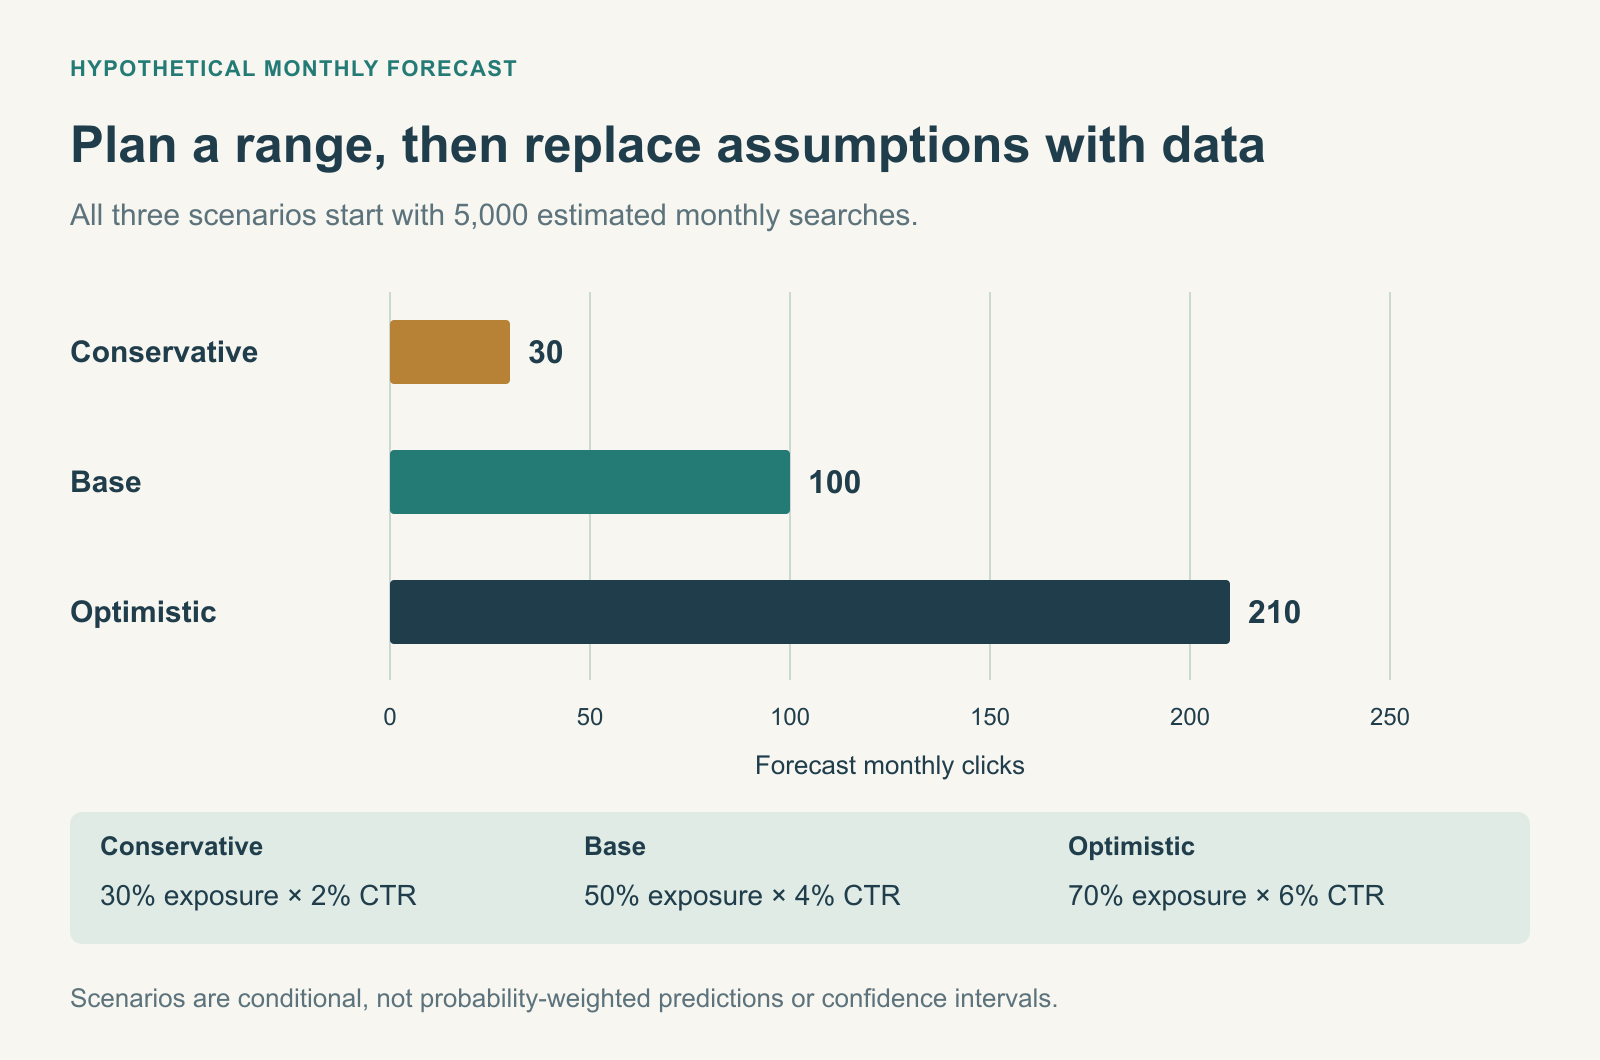
Instead of publishing one expected traffic number, create conservative, base, and optimistic scenarios.
Each scenario should state its assumptions about achievable visibility and CTR.
For example:
| Scenario | Monthly Searches | Expected Impression Share | Expected CTR | Forecast Clicks |
|---|---|---|---|---|
| Conservative | 5,000 | 30% | 2% | 30 |
| Base | 5,000 | 50% | 4% | 100 |
| Optimistic | 5,000 | 70% | 6% | 210 |
All figures are hypothetical.
For a new article, assign a separate probability to reaching each visibility scenario within the forecast period. Don’t present the optimistic scenario as the expected outcome merely because your chosen tool reports low keyword difficulty.
As the article begins collecting impressions and clicks, replace speculative assumptions with observed data.
That makes the forecast progressively more useful.
Once you have a reasonable click estimate, assess what those visits may accomplish.
A keyword generating 150 monthly visitors who are actively evaluating software might be more valuable than one generating 1,500 visitors looking for a simple definition.
That doesn’t mean every commercial click converts or that informational content has no value.
It means the content’s role should determine its success metrics.
For commercially focused pages, consider qualified inquiries, product trials, assisted conversions, and relevant revenue outcomes where measurement supports them.
For introductory and educational content, consider whether it leads readers toward deeper resources, supports relevant discovery, or contributes to clearly defined brand and audience objectives.
Use appropriate attribution methods and avoid assigning revenue to individual queries when the available data cannot support that level of precision.
One important development makes this discussion different from earlier debates about zero-click search.
Google introduced dedicated generative AI performance reports in Search Console on June 3, 2026, with worldwide availability completed by August 31, 2026.
These reports cover impressions associated with AI Overviews and AI Mode on Google Search, with information about appearing pages, countries, devices, and dates.
Source: Google Search Central — Introducing Search Generative AI Performance Reports.
This provides website owners with a separate view of exposure within Google’s AI Search features.
However, the distinction between exposure and traffic still matters.
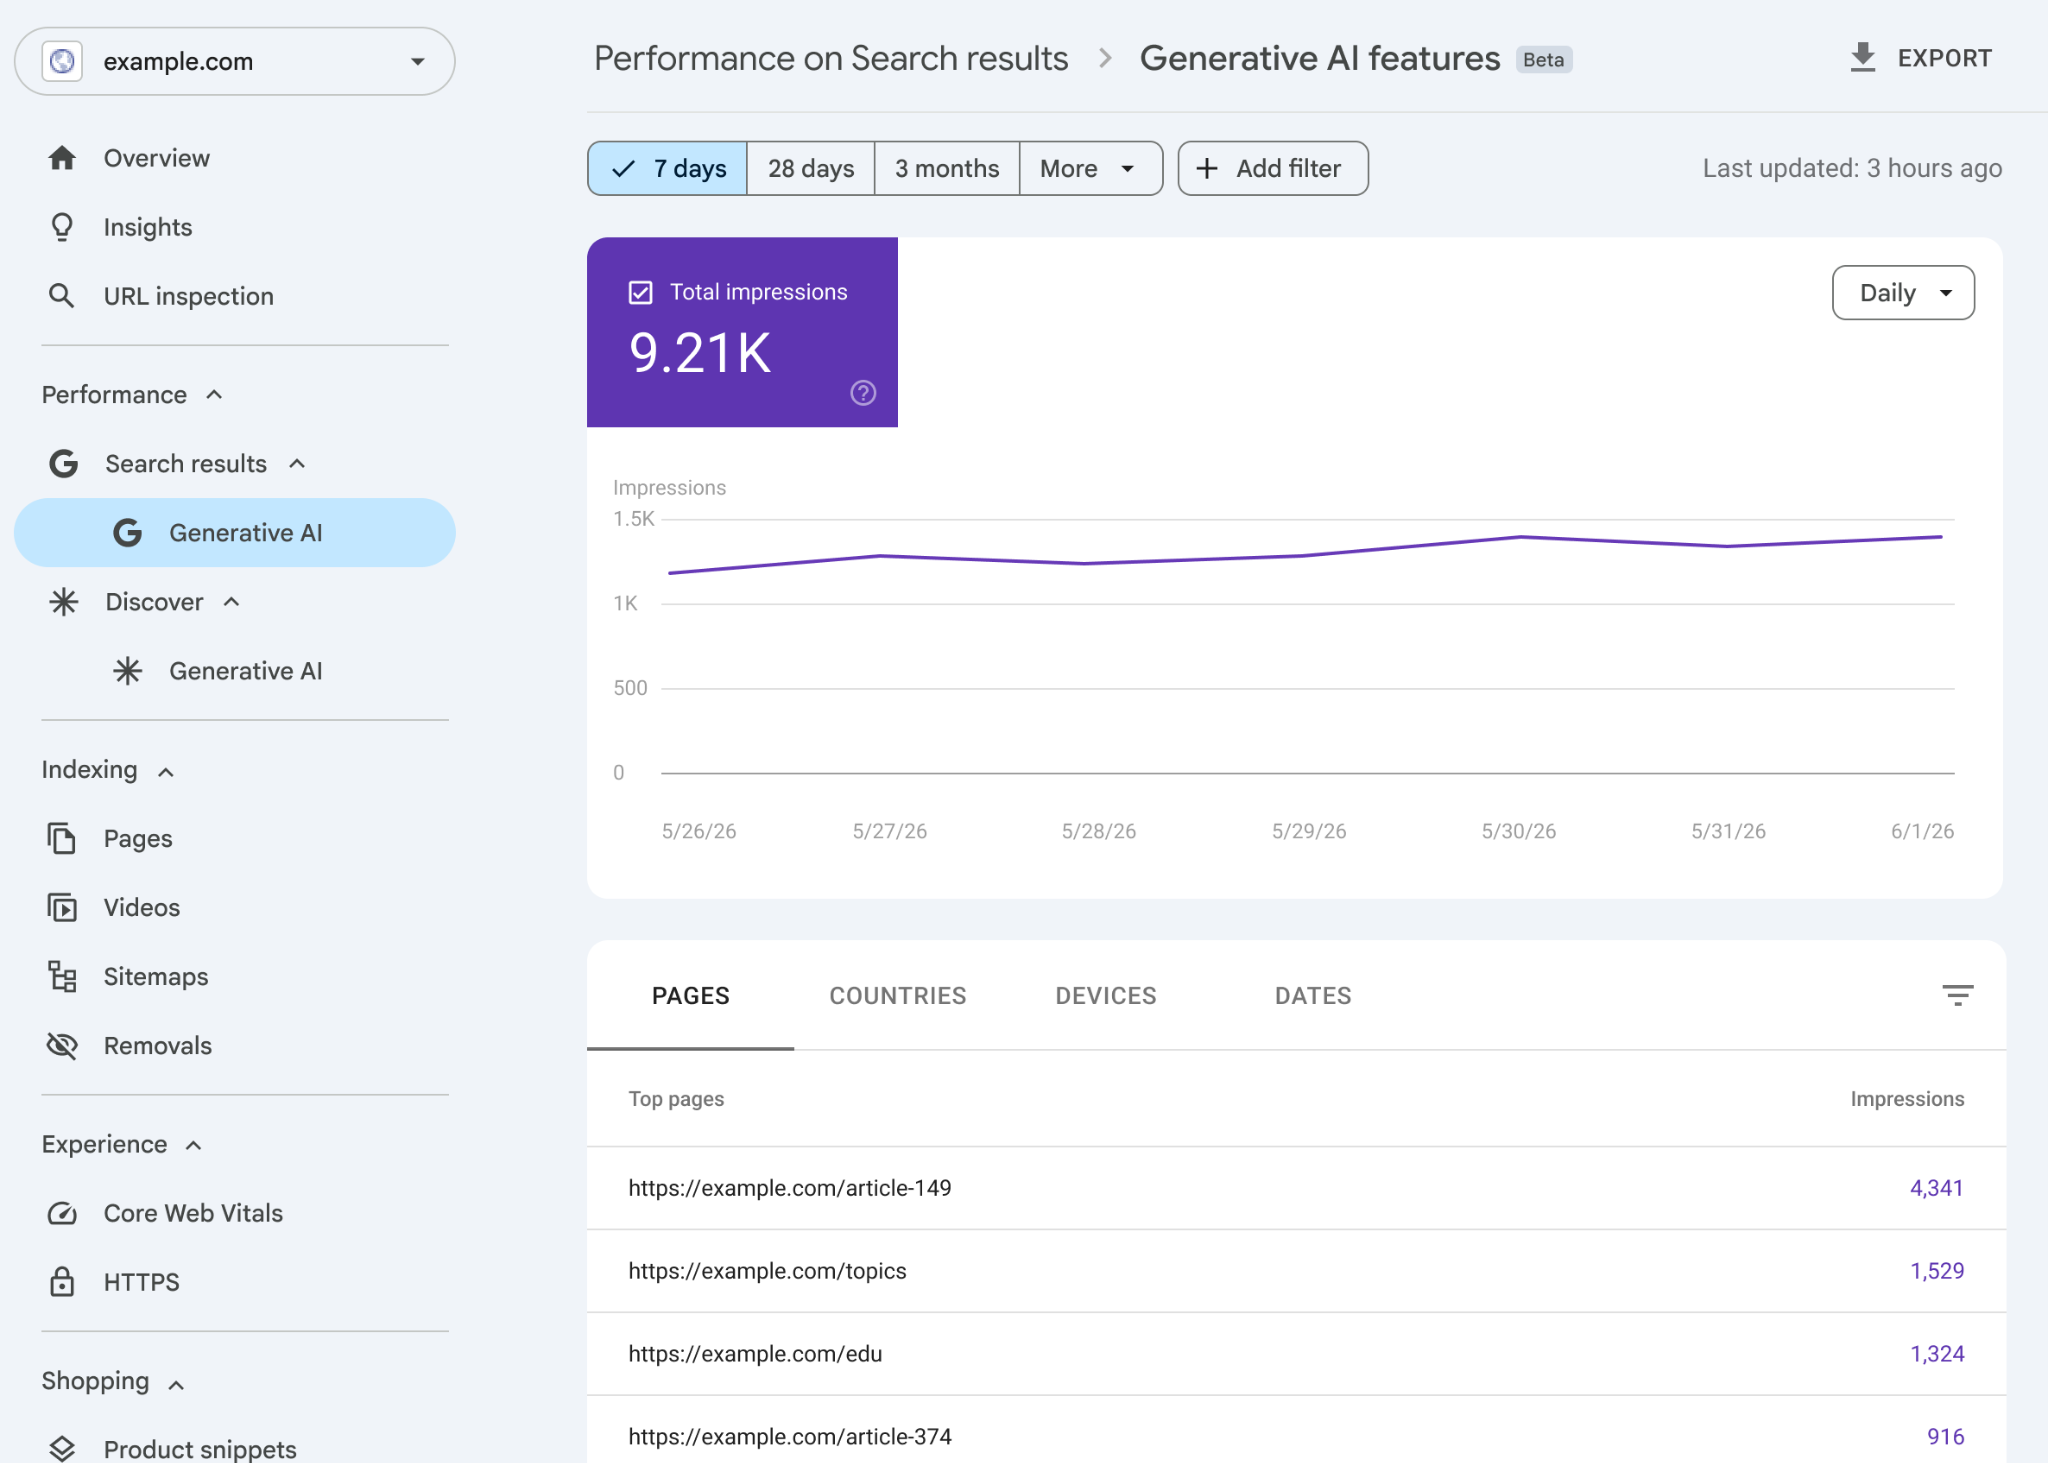
The dedicated Search Console report shows impression data associated with supported generative AI features.
It can help answer questions such as:
These are meaningful reporting improvements.
But AI-feature impressions aren’t equivalent to visits, conversions, or source citations across every AI platform.
Nor does the report provide a complete picture of brand recommendations within services such as ChatGPT or Perplexity.
Google’s ordinary Search performance and generative AI reporting should be interpreted together, not added as though they represent unrelated audiences.
Outside Google, GEO monitoring platforms commonly evaluate selected prompts and record which brands or websites appear in generated answers.
These measurements can be useful, but they are based on specific platform coverage, collection methods, and sampling decisions.
For example, a brand mentioned in 12 out of 20 monitored responses has a 60% mention rate within that sample.
That doesn’t mean the brand appears in 60% of every AI-generated answer on the subject.
The result describes the monitored prompts and response conditions.
Our guide to measuring GEO performance explains how to separate AI mentions, source citations, search impressions, referral traffic, and business outcomes.
The updated reporting approach is not to replace organic clicks with an AI visibility score. It’s to report each measurement according to what it actually represents.
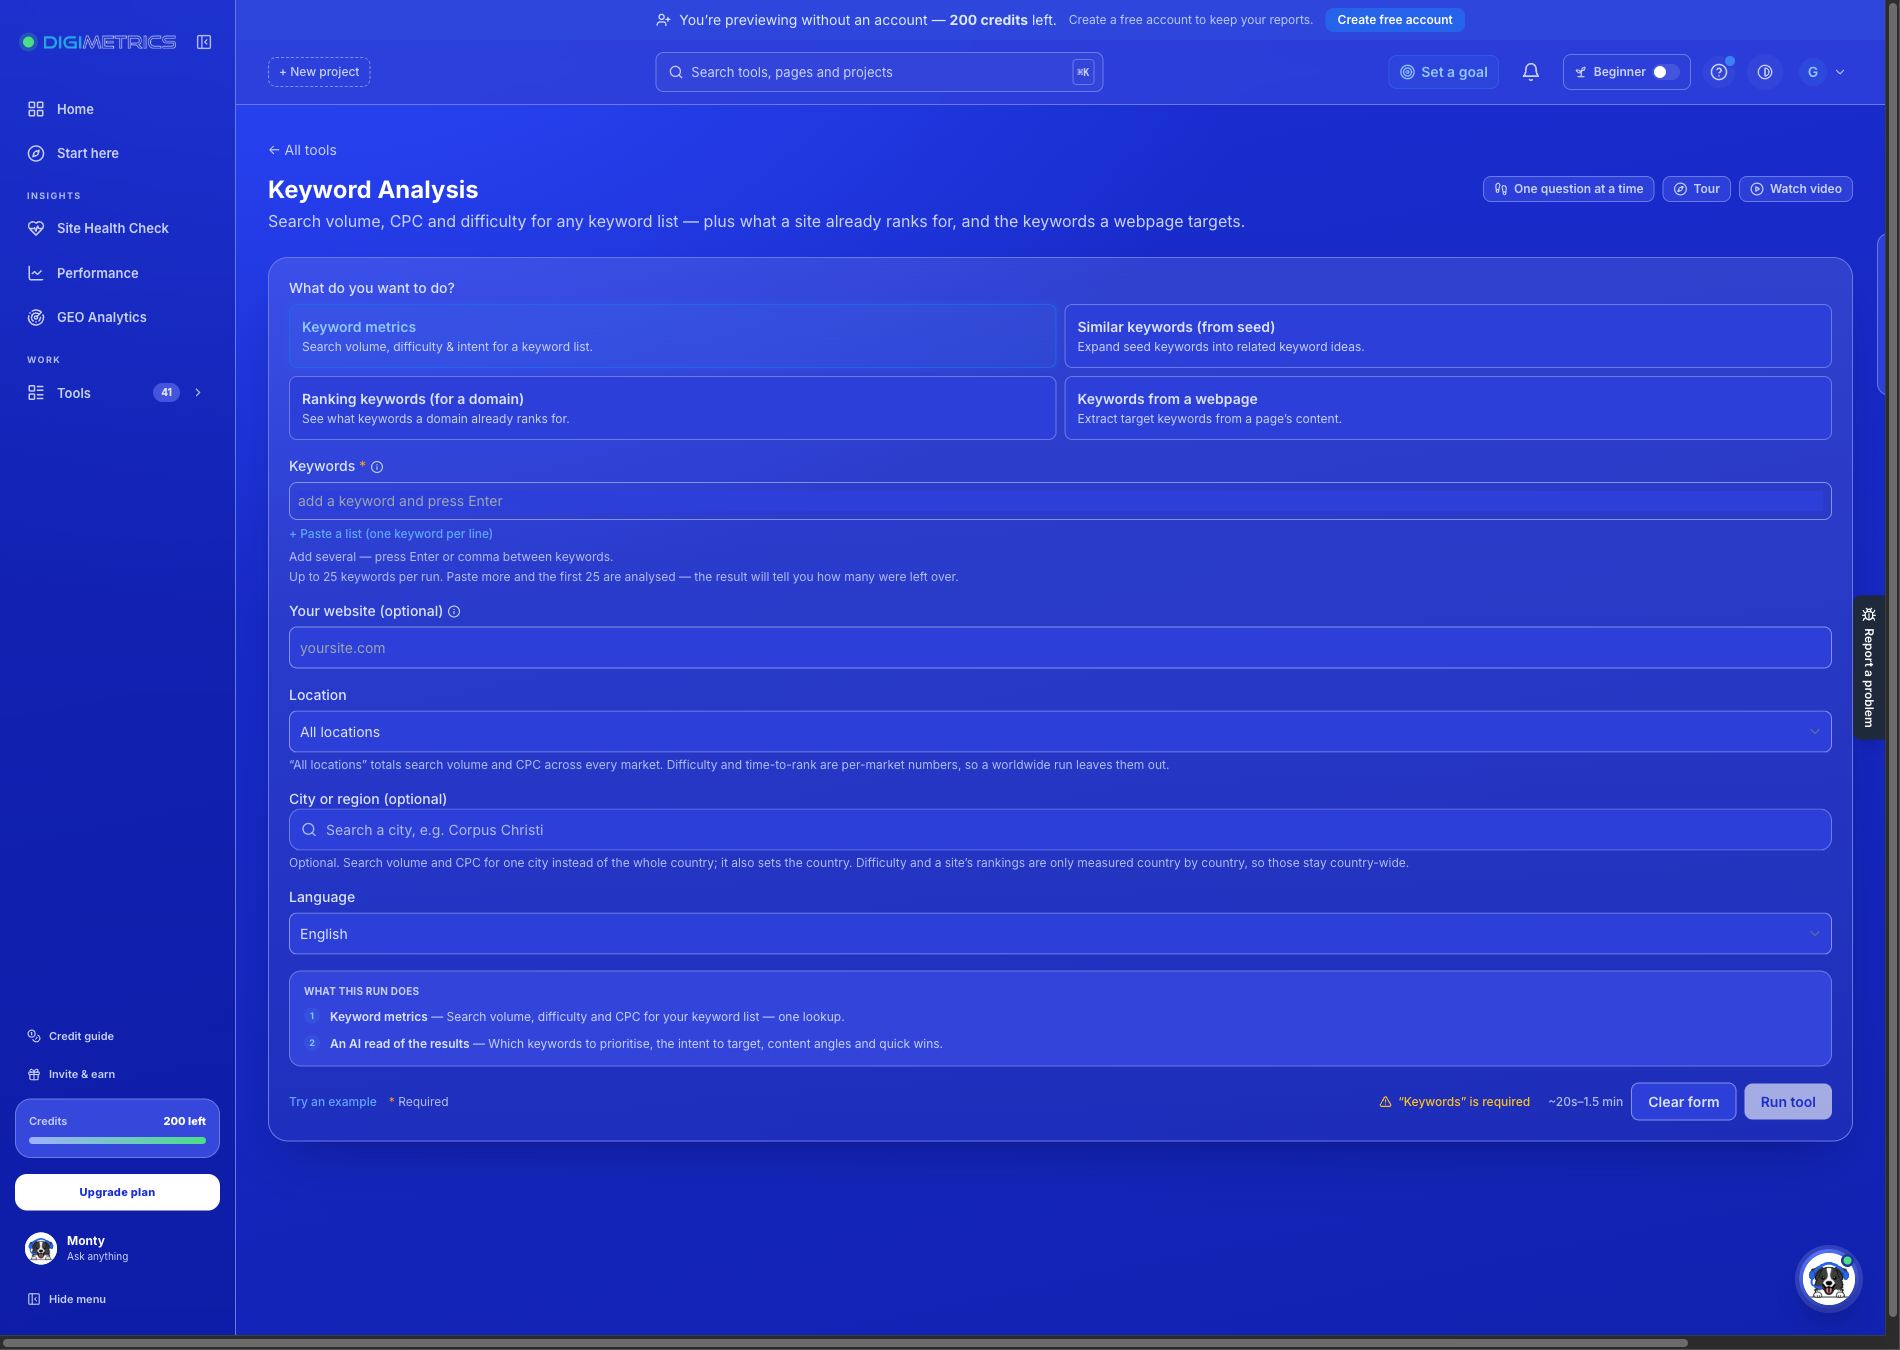
Best suited for: SEO teams looking to examine keyword opportunities alongside search performance and AI visibility within one marketing workspace.
Digimetrics.ai provides keyword analysis, search ranking tools, SEO diagnostics, AI mention tracking, and connections to Google Search Console and Google Analytics 4.
Its Keyword Research tool is designed to support keyword discovery and prioritization, while connected Search Console data supplies actual clicks, impressions, CTR, and ranking information.
Those capabilities can be useful when marketers are reconsidering how they evaluate keyword opportunities.
For example, a team might discover a high-volume keyword through its research tools, examine whether existing pages receive impressions and clicks in Search Console, and assess related AI visibility using the platform’s monitoring features.
That gives the analyst different kinds of evidence to compare rather than relying on search volume alone.
Digimetrics’ published capabilities support keyword research, diagnostics, and connected performance analysis.
However, that doesn’t establish that the platform automatically applies the segment-specific CTR forecasting method described in this article, or that it can precisely predict traffic lost to AI Overviews.
Its AI mention tracking should also be distinguished from Google’s first-party generative AI impression data.
A useful evaluation would test whether the platform helps an analyst identify a mispriced keyword opportunity, understand the supporting data, and make a better content decision with less manual work.
Our assessment: Digimetrics is relevant as a connected SEO and AI visibility workspace. The strongest reason to evaluate it here is its ability to bring keyword and performance information into the same workflow, not a claimed proprietary solution to the changing relationship between search volume and organic clicks.
A conventional SEO report often emphasizes keyword rankings, impressions, clicks, organic sessions, and conversions.
Those metrics remain useful.
The problem arises when the report treats traffic as the complete measure of search visibility, or search visibility as proof of business success.
I’d use three distinct measurement layers.
| Measurement Layer | Main Question | Suitable Metrics |
|---|---|---|
| Search demand and visibility | Are people searching, and can they encounter us? | Keyword demand, rankings, standard search impressions, AI Search impressions |
| Website acquisition and engagement | Are people visiting and interacting with our content? | Search clicks, organic sessions, engagement, landing-page performance |
| Business and AI discovery outcomes | Are we being considered, referenced, or chosen? | Qualified conversions, relevant revenue, monitored AI mentions and citations |
The third layer includes different kinds of outcomes, so its metrics shouldn’t be collapsed into a single score.
A citation isn’t a sale. A brand mention isn’t a recommendation. An impression isn’t a visit.
The value comes from observing these signals together and investigating how they change over time.
For each major content cluster, compare current performance against an appropriate historical baseline.
Report actual organic clicks alongside the revised forecast range.
Where available, include changes in ranking distribution, observed CTR, AI Search impressions, and sampled AI mentions or citations.
Then add business outcomes.
The commentary should explain what changed and what the team plans to do next.
For example, a cluster might maintain impressions and rankings but lose CTR. The recommended action would be to investigate changing search presentation and reassess whether the page needs a stronger reason for readers to visit.
Another cluster might generate fewer visits but more qualified inquiries. That could justify continued investment despite lower overall traffic.
The dashboard should make these decisions easier, not simply introduce more metrics.
The most important consequence of re-baselining is how it changes content prioritization.
A calendar dominated by broad informational keywords may produce less traffic than historical forecasts suggested, particularly when many topics can be answered directly in search results.
But that doesn’t mean the solution is to eliminate educational content.
Instead, I’d review the value each article is expected to create.
A definition or beginner’s explanation can still support an important learning journey.
It may introduce a product category, explain terminology needed for a more advanced guide, or answer a question that existing content doesn’t cover well.
The problem is publishing interchangeable articles with no identifiable purpose beyond capturing search volume.
Prioritize original explanations, practical examples, and topics that connect naturally with deeper resources.
Comparison content is valuable when it helps the reader choose between realistic alternatives.
A useful software comparison should explain who each product suits, what its limitations are, what the pricing means, and which claims have been independently checked.
Simply listing features that vendors already publish adds little.
Comparison pages should earn attention by making decisions easier.
Original testing, unique datasets, implementation screenshots, and documented experiments create information that readers can’t get from a generic definition.
They can also provide material for other publishers and AI systems to reference.
However, original data doesn’t guarantee citations.
Its value depends on whether it is reliable, accessible, relevant, and presented clearly enough to be understood.
Low-volume keywords can represent commercially important questions.
A specific query about fixing a software integration, choosing an enterprise feature, or resolving a costly operational issue may justify content even if keyword tools estimate limited search demand.
Evaluate the business problem, existing competition, and available evidence.
Search volume should help prioritize the opportunity, not automatically determine whether it deserves coverage.
A revised forecasting method isn’t useful merely because the spreadsheet looks more sophisticated.
It needs to be tested against actual results.
I’d evaluate a representative group of existing keyword clusters over several reporting periods.
Use historical performance to establish the baseline assumptions, then apply the new model to a subsequent period that wasn’t used to construct those assumptions.
For each cluster, record:
| Measurement | Why It Matters |
|---|---|
| Forecast clicks | The model’s prediction |
| Actual Search Console clicks | The observed result |
| Absolute percentage error | How far the prediction was from reality |
| Performance by intent segment | Whether one group is systematically over- or under-forecast |
| Forecast preparation time | Whether the process is operationally sustainable |
| Business outcomes | Whether the model helps prioritize valuable work |
For clusters with nonzero observed clicks, a simple absolute percentage error can be calculated as:
Absolute percentage error = |Forecast clicks − Actual clicks| / Actual clicks × 100
For example, predicting 120 clicks when a cluster generates 100 results in a 20% absolute percentage error.
Across a portfolio, avoid relying only on the average percentage error of small-volume keywords. Very small actual values can create misleadingly large percentages.
A weighted absolute percentage error or an analysis of total absolute errors may provide a more useful portfolio-level view.
Also evaluate whether the method improves decisions.
If the new model takes several additional hours each month but doesn’t improve forecast accuracy or content prioritization, its complexity may not be justified.
A successful re-baselining process should make fewer misleading promises and direct effort toward more valuable opportunities.
A keyword with 20,000 estimated monthly searches doesn’t represent 20,000 visits waiting to be captured.
Consider actual search visibility, expected CTR, competing SERP features, and the user’s need to click.
The influence of AI answers depends on the query, platform, search presentation, and user behavior.
Don’t apply research averages as universal coefficients without testing your own keyword portfolio.
Some simple questions are increasingly answered without a click.
That doesn’t make every informational page irrelevant. Evaluate whether the content offers meaningful detail, supports a broader user journey, or serves another measurable purpose.
Comparison and transactional searches can still be influenced by AI answers, advertising, shopping interfaces, and other search features.
Commercial intent can improve business relevance without guaranteeing an organic click.
AI mentions and citations can help evaluate discoverability, but their interpretation depends on how they’re collected.
Don’t treat a sampled visibility score as equivalent to search demand, website visits, or conversions.
This article uses publicly available research on AI-related search behavior, official Google documentation, and a proposed framework for updating keyword research and SEO traffic forecasts.
The primary evidence includes Pew Research Center’s July 2025 analysis of Google search behavior, Ahrefs’ February 2026 organic CTR study, Google Ads documentation describing keyword-volume estimates, and Google Search Console’s current performance reporting.
These sources support the conclusion that search volume alone is an insufficient traffic predictor and that AI-generated search results can affect click behavior.
They don’t establish a universal CTR reduction for every keyword, website, market, or search platform.
The segment classifications, forecasting scenarios, and calculations in this article are proposed methods and illustrative examples.
DMT has not presented them as the results of a completed controlled keyword-forecasting experiment.
A future benchmark should compare historical forecasts with observed Search Console performance, disclose keyword selection, document SERP features and ranking conditions, and measure predictive error across several periods.
Keyword research isn’t dead.
Search volume still provides useful information about what people want to know, which topics attract interest, and where businesses may find relevant opportunities.
But the historical relationship between demand, ranking position, and organic traffic has become less dependable.
Simple questions may be answered directly in search results. AI-generated summaries can influence whether users click, and the effect isn’t consistent across search intents.
That makes volume-only prioritization increasingly risky.
The practical response is to classify keywords by intent, examine actual SERP behavior, calibrate CTR assumptions using first-party data, and forecast traffic in defensible ranges.
Then evaluate business outcomes.
A lower-volume comparison that generates qualified inquiries may deserve more investment than a broad definition that attracts attention but produces little useful engagement.
At the same time, informational content shouldn’t be discarded when it helps readers, supports deeper learning, or contributes to measurable business objectives.
The question is no longer simply how many people search for a keyword. It’s how many of those searches can realistically lead to the outcome your business needs.
That is the adjustment modern keyword research requires.
Search volume remains an input.
It just shouldn’t be mistaken for the answer.
For related keyword research, ranking, and optimization guides, explore our SEO tools and guides.
Yes. Keyword research remains useful for understanding search demand, identifying customer questions, examining competition, and planning content. What needs adjustment is the assumption that a particular search volume and ranking position will consistently produce the same amount of traffic.
It can, particularly on queries where users obtain satisfactory answers without clicking. Pew Research Center and Ahrefs have documented lower click activity or CTR associated with Google AI summaries. The effect varies by query type, search environment, and website.
Search volume is an estimate rather than an exact count of available visits. Google Keyword Planner uses historical search information and close variants, with rounding and defined location and period settings. Third-party SEO tools may use other estimation methods.
Start with search demand, then account for realistic visibility, observed CTR, search intent, and SERP features. Use your own Search Console data where possible and create forecast ranges for uncertain outcomes rather than applying one generic CTR figure across all keywords.
Potentially. An AI Overview doesn’t automatically eliminate all clicks or the value of a topic. Evaluate whether your page provides useful information beyond the generated answer, whether users may need deeper resources, and whether the query supports relevant business goals.
Comparison keywords often have clearer commercial intent, but they aren’t universally better. A useful informational article may generate substantial value through education, discovery, or qualified leads. Evaluate each topic according to its role, expected click behavior, competition, and business relevance.
A zero-click search occurs when the searcher doesn’t click through to an external website from the search results. The user may find the answer directly, continue searching, or end the session. AI-generated summaries are one factor influencing this behavior, alongside older search features.
Yes. Google introduced dedicated generative AI performance reports in 2026, with worldwide rollout completed by August 31. These reports show impression data for supported Google Search AI features, including AI Overviews and AI Mode. They shouldn’t be confused with direct measurements of all AI citations or business outcomes.
Not by itself. Search Console provides first-party information about your own website’s Google Search performance, but it doesn’t fully replace competitor research, market-wide demand estimates, or keyword discovery tools. Combining these sources helps distinguish opportunities from existing performance.
Digimetrics provides keyword research and analysis tools alongside ranking, SEO diagnostics, AI mention monitoring, and connected Search Console and GA4 data. These can support an integrated research and reporting workflow, but its publicly documented features don’t establish a proven automatic correction for AI-related search traffic loss.
Review forecasts regularly, particularly when search behavior, rankings, SERP features, or content priorities change. A monthly review may be appropriate for an active content program, with deeper recalibration after enough new performance data has accumulated.

Tom is the CEO of MediaOne, a leading digital marketing agency. He is a business-experienced SEO consultant as well as a Google Gold Search Expert serving the international community. He has consulted for MNCs like Canon, Maybank, Capitaland, SingTel, ST Engineering, WWF, Cambridge University, as well as Government organisations like Enterprise Singapore, Ministry of Law, National Galleries, NTUC, e2i, SingHealth. His articles are published and referenced in CNA, Straits Times, MoneyFM, Financial Times, Yahoo! Finance, Hubspot, Zendesk, CIO Advisor. Under his stewardship, MediaOne has won dozens of prestigious digital marketing awards.
Run a free Digimetrics audit across SEO, AI search, content and technical health, and get a plan you can act on today.
Start free →Yes, Ahrefs has a free AI Visibility Checker. You can enter a brand name, inspect its presence across six AI search experiences, and see…
Your website ranks on Google. Your SEO dashboard shows healthy organic traffic, and your brand appears for several commercially valuable keywords. But when someone…
Direct answer: To rank in Perplexity and ChatGPT, answer one narrow question clearly, make each claim easy to check, and structure the page so…