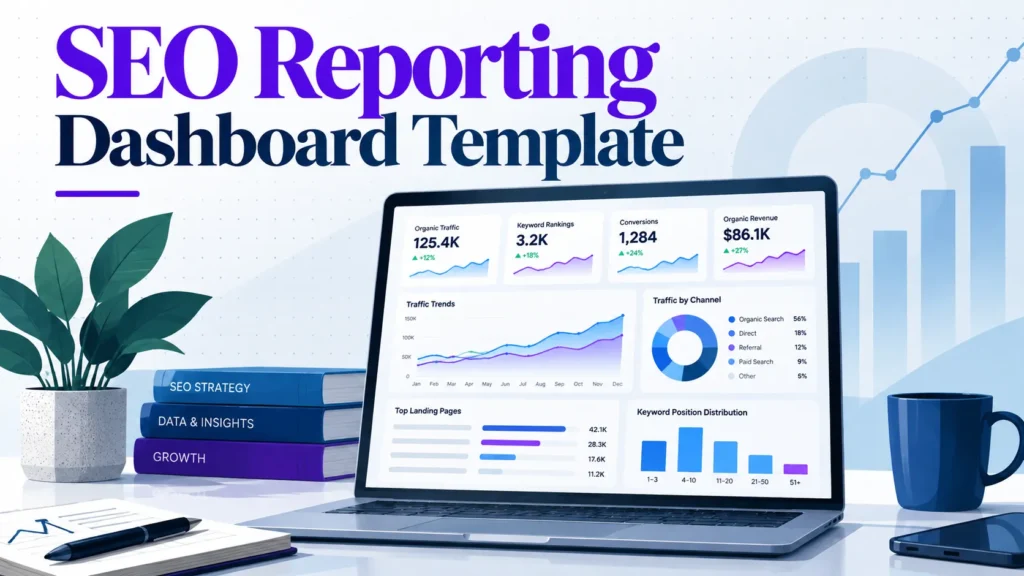
Most SEO dashboards report what the SEO team did, not what the business needs to decide. Rankings, impressions and crawl counts fill the screen, yet the executive reading it still cannot tell whether to fund more content or pause a migration. This guide takes a different approach. Build the dashboard backward from the decisions stakeholders make each month. Attach one leading indicator and one outcome metric to each decision. Agree the threshold that triggers action before reporting begins, and drop every metric that changes no decision. Figures are shown in US dollars, and the examples assume the platforms most US teams already use, including Google Search Console, Google Analytics 4 and Looker Studio.
Copy-ready template at a glance
Top band: organic revenue or qualified leads, with change against the previous period and the target.
Middle band: trend charts and segmented comparisons by landing page group.
Bottom band: top movers, technical issues and the recommended action for each.
Thresholds: fill in the table in the Step 3 section from your own baseline before the first report.
The full build steps and the layout details follow below.
A dashboard is a decision tool. Build it backward from the three to five decisions a stakeholder makes each month. Cut any metric that does not change one of them.
Lead with business outcomes, then explain them. Organic revenue or qualified leads go at the top. Rankings and impressions stay as supporting diagnostics.
Set thresholds before the first report. Agree targets and alert levels with stakeholders in advance, so no one reads the data selectively once results arrive.
Separate what the SEO team controls from what it only influences. Crawl errors and indexed pages are within your control. Organic revenue and brand search volume are shaped by many other factors.
Annotate changes and state attribution limits. Algorithm updates, site releases and seasonal patterns explain many swings. Admitting what analytics cannot prove builds more trust than an overstated revenue claim.
Fewer, linked metrics beat a comprehensive dashboard. Each extra metric dilutes attention and invites cherry-picking.
Most SEO dashboards are built around the numbers the SEO team finds easiest to collect: rankings, impressions, average position and sessions. These figures are real and take effort to gather, which makes them feel important. A stakeholder reading them cannot tell whether the business is better off than last month. The dashboard rarely says what to do about it. Dashboards that report activity are often left unopened, while those that report outcomes get read.
Three failure patterns account for most of the damage.
The vanity-metric trap
Rankings and impressions measure visibility, not value. A page can climb from position 9 to position 4 for a query nobody buys on. The dashboard shows a green arrow while revenue stays flat.
Impressions can rise for reasons unrelated to performance. A competitor’s result may have disappeared, a new SERP feature may have pushed the listing down, or a query may have picked up seasonal interest. None of this tells a finance reviewer whether to spend more.
The fix is not to delete visibility data. Place every visibility number beside the business outcome it is meant to move. A ranking gain is worth showing only next to organic leads or the revenue from the pages that gained position.
Reporting cadence mismatches
SEO teams usually work in weekly cycles: crawl reports, ranking changes and content releases. Executives review performance monthly or quarterly. When the two rhythms collide, the executive receives a weekly volatility chart that looks alarming, or a quarterly summary that arrives too late to act on.
A useful dashboard separates the two views on purpose. The operational view can update weekly for the SEO team. The stakeholder view should follow the review cycle the business already uses, with the same metric definitions and date ranges each time. Changing the reporting rhythm without telling anyone is one of the fastest ways to lose trust in the numbers.
The data dump problem
A dashboard with twenty-four charts rarely supports twenty-four decisions. Each extra chart dilutes attention. It invites the reader to pick whichever line supports their existing view, and it hides the change that actually moved the business.
Many stakeholders ask questions about the first chart they see. The chart that signals a real problem often sits unread at the bottom of the page.
Every chart should answer a question someone is responsible for answering. If no one can name the decision a chart supports, the chart belongs in the working file, not on the stakeholder page.
Arguing against the transparency view
The strongest competing view holds that a dashboard is a transparency record: it shows everything the SEO team did, so no one can accuse the team of hiding work. The argument has merit. Stakeholders deserve to see effort, and a record of activity protects the team when results lag.
The view fails in practice. A full record gives an executive no basis for a budget decision, because activity is not evidence of return. Teams that report everything usually end up explaining the same chart again each month. A transparency log belongs in a separate appendix or working file. The stakeholder page should carry the handful of numbers that support a decision.
The thesis: a dashboard is a decision tool
A stakeholder dashboard is a decision tool for the people who fund and prioritize the work. You start from the decisions a stakeholder must make each month, such as whether to fund a content refresh, reprioritize technical fixes or expand into a new market. For each decision, choose one leading indicator and one outcome metric. Agree on a threshold that triggers action before reporting starts.
Any metric that supports no decision comes off the page. A smaller set of metrics produces more useful reporting than a complete one. The next sections show how to build that structure, starting with who the readers are and what each one needs to decide.
Table of Contents
Who the Dashboard Is For and What Each Reader Needs
Core Metrics: What to Include and What to Leave Out
Choosing Data Sources and Connecting Them
Step-by-Step: Building Your SEO Reporting Dashboard Template
Dashboard Layout Template (Copy-Ready Structure)
Conclusion and Next Steps
Frequently Asked Questions
Who the Dashboard Is For and What Each Reader Needs
A single dashboard usually fails because it tries to serve everyone at once. Each reader asks a different question. Name the reader, the decision they face and how often they will look before choosing any metric.
The executive or CMO: revenue, pipeline and risk
The executive reads the dashboard to decide whether SEO deserves more budget, less budget or a change in direction. The top of the page should show organic revenue or qualified leads. Compare these with the previous period and with the target for the quarter. Rankings and impressions belong lower down, if they appear at all.
Risk matters as much as performance. A short watch list of two or three items tells the executive where a surprise could come from. Examples include a template change scheduled for next month or traffic concentrated in one product line. Keep the executive view to one screen. If the answer needs scrolling, the decision gets made without it.
The marketing manager: channel mix and content performance
The marketing manager sits between strategy and execution. They need to see how organic search fits alongside paid, email and social, and which content groups drive conversions. The useful views are segmented: organic leads by landing page group, conversion rate by content type and non-branded clicks by topic cluster.
This reader is most likely to spot a misleading average. A blended conversion rate can hide a blog section that brings traffic but no leads. Break the data down to the level where content decisions are made. Label branded and non-branded traffic separately so the two are never mixed.
The developer or product owner: technical health and error trends
The developer cares whether the site is crawled, indexed and rendered correctly, and whether a release broke something. Show indexation rate, crawl errors, Core Web Vitals pass rate and the count of pages returning server errors. Add a timeline that marks each deployment.
The most valuable element for this reader is an annotation layer. When a drop in indexed pages lines up with a release date, the developer can investigate at once. Keep the technical view to a short list of signals that point to a specific fix. A full site audit belongs in a separate tool.
The finance or leadership reviewer: cost, return and forecast accuracy
The finance reviewer asks whether SEO spend produces a return that can be defended. Show the cost of SEO activity, including agency fees, tool subscriptions and content production. Set it against organic revenue or pipeline value. Show how reliable past forecasts have been. A forecast that missed by a wide margin reduces trust in every future number. Use a labelled illustrative figure, not a reported result, when showing this in a template.
Be honest about attribution. Organic search rarely closes a deal alone, and last-click models understate its role. State the attribution model in plain terms on the page. Show a range where the true figure is uncertain. A reviewer who sees the limits is more likely to trust the headline number than one who sees a precise figure with no caveat.
Practical step: list your readers before you open any tool
Write one row per reader with three columns: the decision they make, the metric that informs it and the review cadence. If a reader has no decision attached, remove them from the distribution list. This exercise shapes which metrics survive the filter in the next section.
Core Metrics: What to Include and What to Leave Out
Most SEO dashboards carry far more metrics than a stakeholder can act on. A metric earns a place on the dashboard only if it would change a decision. The sections below group the candidates into four families, then finish with a test you can apply to any metric, including the ones your tools suggest.
Business outcome metrics: organic revenue, leads and assisted conversions
These are the numbers executives fund. Organic revenue, or organic lead volume for businesses that do not transact online, answers one question: what did search contribute this month?
Assisted conversions show search influence earlier in the buying path. A visitor finds you through a non-branded query, leaves, and converts later through a different channel. Search played a part, even though it did not get the last click.
Two cautions apply. Google Analytics 4 attributes revenue using its own attribution model, so organic revenue will not match your finance system to the dollar. State the model on the dashboard. Second, agree the definition of a “lead” with sales before you report it. A form fill that sales never qualifies should not count as a win.
Visibility metrics: non-branded share of clicks, share of voice and priority query coverage
Raw clicks and impressions mostly reflect brand demand, which SEO does not fully control. Non-branded share of clicks isolates the traffic that search work actually earns. Track it as a percentage of total organic clicks. Use a regex filter in Search Console, a pattern-matching rule, to exclude brand terms.
Share of voice shows your visibility against competitors for a defined keyword set. Priority query coverage shows what share of the queries that matter to revenue you rank for in the top positions. Keep the set short, perhaps 50 to 200 queries, and fix it for the year. Changing the set mid-period makes trends meaningless.
Engagement and quality metrics: conversion rate by landing page group, engaged sessions
Traffic that does not engage is a warning sign, not a success. Group landing pages by template or content type, such as product, category, guide or comparison. Report conversion rate for each group. A blended site-wide average hides the group that is underperforming.
Engaged sessions are a usable proxy for quality. These are sessions lasting at least 10 seconds, with a conversion, or with two or more pageviews. Pick one definition, document it, and keep it stable. Bounce rate from older Universal Analytics setups is not directly comparable with GA4 engagement metrics. Do not place historic and current figures on the same line without a note.
Technical health metrics: indexation rate, Core Web Vitals pass rate, crawl errors
These metrics belong to the SEO team and to developers. They belong on the dashboard because they show whether the site can earn visibility at all.
Indexation rate is the share of your known pages that Google has indexed. It reveals coverage problems. The Core Web Vitals pass rate shows the share of URLs meeting Google’s thresholds for loading, responsiveness and visual stability. Check the official Core Web Vitals thresholds for the current values. Crawl errors indicate server or configuration faults.
Report these as a health summary with a count of issues and a trend, not a list of every URL. Put the detail in a technical backlog and link to it from the dashboard. Before reporting any incident, check Google’s Search Status Dashboard for confirmed Google-side problems.
A filtering test for every metric before it goes on the dashboard
Apply these four questions to each candidate metric. If it fails any of them, remove it or move it to a secondary report.
Question
Keep if
Remove if
Does it support a named decision?
You can name the decision and the action it triggers
It is interesting but changes nothing
Can the SEO team influence it?
It is a control metric (such as crawl errors) or a clearly labelled influence metric
It is presented as SEO’s direct output but depends mostly on brand or market demand
Is the definition stable?
The formula is documented and unchanged
It has been redefined, or two tools disagree without a reconciliation note
Does a threshold exist?
You and stakeholders agreed what good and bad look like before reporting began
Nobody can say whether a number is high or low
The threshold question does the most work. A metric without an agreed threshold invites selective reading. Whichever number looks favourable gets quoted, and the unfavourable ones get explained away. Set the threshold first, then report against it.
A richer dashboard does not serve stakeholders better. Each extra metric dilutes attention. It makes it harder to see which change moved the business, and it gives the team more numbers to cherry-pick. A smaller set of metrics, each tied to a decision and a threshold, produces reporting that stakeholders trust and act on.
Choosing Data Sources and Connecting Them
A dashboard is only as trustworthy as the data behind it. Stakeholder disputes often trace back to a metric pulled from the wrong tool, a date range that differs between two charts, or a number nobody could explain. The fix is not a better chart. It is a clear decision about which source answers which question, and an honest note about where each one falls short.
Google Search Console and what its data does and does not show
Google Search Console is the primary source for search visibility. It reports impressions, clicks, average position and click-through rate for queries and pages. It is free and comes directly from Google. Its Search Console Help documentation explains how each metric is defined.
It does not show everything. Three limits matter for stakeholder reporting:
Position is an average. It is the mean position across all impressions for a query or page. A page can show position 8 while ranking first for some searches and page four for others.
Some queries are hidden. The total clicks in the overview include everything, but the queries report only shows part of it because Google hides some low-volume or anonymous queries.
Recent data is preliminary. Recent data can still change as processing continues. Treat the most recent two or three days as provisional.
Search Console cannot tell you whether a visit converted. That is why it belongs in the visibility section of the dashboard, not the revenue section.
Google Analytics 4 setup for organic channel reporting
Google Analytics 4 (GA4) answers what happens after the click. For organic reporting, four setup decisions matter:
Check the default channel group. GA4 classifies traffic as “Organic Search” based on referrer and medium. Check the Traffic acquisition report to confirm organic sessions look sensible before building on top of them. GA4 attributes conversions using its data-driven or last-click model, depending on your settings. Confirm the model in Google’s attribution documentation.
Mark key events as conversions. Define the leads, purchases or sign-ups that matter, then mark them as key events so they appear in acquisition reports.
Separate branded and non-branded traffic. GA4 does not split these automatically. Create a custom channel group, or a Looker Studio calculated field using a regex on the query where available. Label the split clearly on the dashboard.
Watch for consent and tracking gaps. Consent mode and ad blockers reduce recorded sessions. Compare GA4 totals against server logs or your CRM where possible, and report the gap rather than hiding it.
Field performance data (CrUX) and GA4 event parameters
Core Web Vitals data in Search Console comes from the Chrome User Experience Report (CrUX). CrUX holds real-user field data, which is more representative than lab tests but aggregated and delayed. Use it for trend reporting. Use a lab tool to diagnose a specific page.
To link a Looker Studio data source to GA4 event parameters, add the parameter as a dimension in the GA4 connector. Event parameters are stored as separate fields, so a custom dimension must exist in GA4 before it appears in Looker Studio. Check the field names in the connector before building a chart on them.
Rank tracking and third-party crawl data
Rank tracking tools and crawlers fill gaps that Search Console leaves. A rank tracker checks a fixed set of keywords on a schedule, with the device and location controlled. That consistency helps when Search Console averages shift with query mix. A crawler reports indexation, status codes, redirect chains and canonical conflicts across the whole site.
Use these sources for diagnosis and for priority-query monitoring, not as a replacement for Search Console. Rank tracker positions are a simulated view of the results page, so they will not match Search Console averages. State that difference once, on the dashboard, to prevent a long argument later.
Connecting sources in Looker Studio, with a note on data freshness and sampling
Looker Studio connects natively to Search Console, GA4 and Google Sheets. It can blend them on a shared dimension such as date or landing page. Three practical points apply:
Blending needs a common key. Blend Search Console and GA4 by landing page path or date, not by query, because GA4 does not hold query data.
Freshness varies by connector. Search Console data is updated with a short delay, and GA4 can take a day or more to finalize. Show a “data as of” date so readers know what is provisional.
Sampling can apply. GA4 applies sampling to very large explorations, and Looker Studio caches query results. Sampling only applies to large explorations. For monthly executive views it rarely changes the story. For a report that drives budget decisions, check large date ranges against the native GA4 interface. Verify current limits in Google’s documentation.
Reconciling discrepancies between tools
Search Console clicks and GA4 organic sessions will never match exactly. Expect a gap, then explain it. The usual causes are:
Search Console counts clicks, while GA4 counts sessions. Sessions can be lower when consent is declined or scripts fail to load.
GA4 attributes traffic to the source of the session. Search Console attributes it to the search result.
Time zones and processing delays differ between the two.
A practical routine: compare monthly totals for one landing page group, record the ratio, and check whether it stays stable. If it moves sharply, investigate tracking before reporting a traffic change. A stable ratio means your trend lines can be trusted even when absolute numbers differ. That is the point stakeholders most need to understand.
Step-by-Step: Building Your SEO Reporting Dashboard Template
Start with the decision a stakeholder has to make, then work backward to the data. Each step below produces something you can paste into a working file, so you finish with a usable first version of your SEO reporting dashboard template.
Step 1: Define the three questions the dashboard must answer
List the three to five decisions a stakeholder will make next quarter. Common examples include whether to fund a content refresh, whether to move engineering time onto technical fixes, or whether to expand into a new market. Reduce the list to three questions the dashboard must answer every reporting period.
Phrase each question as something a person could say out loud. “Is organic search producing enough qualified leads to justify the content budget?” works. “How is our SEO performing?” does not, because nobody can act on it.
Any metric that does not help answer one of these three questions does not belong in the first version. Keep the list short. A dashboard built to answer three questions is easier to read than one built to show everything the team can measure.
Step 2: Map each question to one metric and one data source
For each question, choose one leading indicator and one outcome metric. Then name the single system that holds the data. Keep these pairings tight.
Question
Leading indicator
Outcome metric
Data source
Is content earning qualified demand?
Impressions for priority non-branded queries
Organic leads per month
Google Search Console, then GA4 conversions
Are technical issues limiting visibility?
Share of priority URLs indexed
Organic sessions to indexable pages
Search Console indexing report, GA4
Is organic growth reaching revenue?
Non-branded clicks
Organic revenue or pipeline value
GA4 with conversion values, CRM data
Two warnings apply here. First, GA4 and Search Console will not agree exactly. Pick one as the source of truth for each metric and state it on the page. Second, attribution is partial. Organic revenue in GA4 depends on the attribution model you configure. Many leads close after a sequence of touchpoints that analytics cannot fully see. Say this openly on the dashboard. Stakeholders who discover the limit later will distrust every other number.
Label each metric by who controls it. Crawl errors and indexed page counts sit within the SEO team’s control. Organic revenue and brand search volume are influenced by SEO but driven by many other factors. Putting both on one scorecard without that distinction invites unfair blame or unearned credit.
Step 3: Set targets, thresholds and alert levels
This step matters most, and teams often skip it. Agree on thresholds with stakeholders before the first report goes out. If you set them afterward, the dashboard becomes a tool for justifying whatever happened, and readers will rightly question it.
For each outcome metric, define three levels:
Target: the level the business expects in normal conditions, for example 120 organic leads a month.
Warning threshold: a level that prompts investigation, for example a drop of 15 percent against the trailing three-month average.
Action threshold: a level that triggers a named response, for example two consecutive months below the warning threshold, which prompts a content audit owned by a named person.
Write each action down with an owner. A threshold with no consequence is decoration. The fill-in table below shows the format: decision, leading indicator, outcome metric, threshold, and the action if the threshold is missed. Leave the threshold cells blank and populate them from your own baseline.
Decision
Leading indicator
Outcome metric
Warning threshold
Action threshold
Action and owner
Not confirmed
Not confirmed
Not confirmed
Not confirmed
Not confirmed
Not confirmed
Not confirmed
Not confirmed
Not confirmed
Not confirmed
Not confirmed
Not confirmed
Not confirmed
Not confirmed
Not confirmed
Set thresholds using at least three months of baseline data where you have it. Where you do not, state that the targets are provisional and review them after one quarter.
Step 4: Lay out the page: summary row, trend section, diagnostic section
Build the page in three bands, read top to bottom.
Summary row. Show three to five headline KPIs. Each shows the current value, the change against the previous period, and a status color tied to the thresholds from Step 3. A reader should be able to answer “are we on track?” from this row alone.
Trend section. Show two to four charts of the outcome and leading indicators over at least twelve months, so seasonality is visible. Keep the period selector and comparison period consistent across charts.
Diagnostic section. Show segmented views that explain movement, such as branded against non-branded traffic, landing page groups, and device or country splits where relevant. This is where the analyst goes when a headline number moves.
Looker Studio supports this layout with scorecards, time series charts and filter controls. If you need the wider toolset that feeds these charts, the seo tools guide explains how the categories fit together. Keep each band to one screen. If a stakeholder has to scroll through six pages, the summary row is no longer doing its job.
Step 5: Add annotations for algorithm updates, site migrations and releases
A line chart without context invites false conclusions. A traffic dip in the week of a core update looks identical to a dip caused by a broken template, but the response should be completely different.
Keep a shared change log and surface it on the dashboard. Record four types of event:
Confirmed search engine updates, using dates from Google’s official Search Status Dashboard.
Site migrations, redesigns and domain changes.
Major content or template releases that touched indexable pages.
Known seasonal patterns, such as a retail peak or a quiet summer period for B2B.
Test the dashboard with real readers
Before publishing, put the draft in front of two or three people from different stakeholder groups. Ask them four questions:
What do you think the headline number means?
What would make you act on this?
Which metric did you ignore, and why?
What question do you still have that the page does not answer?
Their answers show which metrics are doing work and which are noise. Remove the noise, relabel anything that was misread, and run the test again with a second reader if the first session revealed major problems. Only then publish to the wider group. Revisit thresholds and layout after the first full reporting cycle. The real test is whether the dashboard changed a decision.
Dashboard Layout Template (Copy-Ready Structure)
Every stakeholder dashboard follows the same three-band layout. Executives scan top to bottom and stop once they find the answer. The structure below can be copied into Looker Studio or a spreadsheet. Replace the placeholders with the metrics your decision matrix has justified.
Top row: headline KPIs with period-over-period change
The top row answers one question: is organic search moving the business in the right direction? Place four to six scorecards across the top. Each shows the current value, the change against the previous period, and the change against the same period last year where seasonality matters.
For a US business reporting in US$, a workable top row looks like this:
Scorecard
Source
Comparison shown
Organic revenue (USD)
GA4, linked to conversions
Month over previous month, and year over year
Organic leads
GA4 conversion events
Month over previous month
Non-branded clicks
Search Console, branded queries excluded
Period over period
Indexed pages on priority templates
Search Console Pages report plus crawl data
Period over period
Core Web Vitals pass rate
Search Console Core Web Vitals report
Period over period
Two rules keep this row honest. First, show the percentage change and the absolute change together. A 40 percent rise on 12 leads is not the same signal as a 40 percent rise on 1,200. Second, color the change only against a threshold agreed in advance with stakeholders, not against zero. A green arrow for a 2 percent gain is noise that invites overreaction.
Middle section: trend charts and segmented comparisons
The middle band explains the top row. When organic leads fall 15 percent, stakeholders look here to see whether the drop is site-wide or concentrated in one area.
Use three to four charts at most:
A 12-month trend line for organic revenue or leads, with algorithm updates, site migrations and releases marked on the timeline (covered in Step 5 of the build process).
A segmented bar chart comparing landing page groups, such as product pages, blog content and category pages, by conversion rate and by revenue.
A branded versus non-branded split over time, so a rise in brand searches cannot hide a fall in discovery traffic.
A device or country breakdown, included only if your revenue depends on it. For most single-market US businesses, this chart adds a panel without adding a decision.
Keep comparison periods identical on every chart. When a stakeholder sees a monthly chart next to a weekly one, they will draw a conclusion the data does not support. Set one default date range for the whole page and let the date control change it globally rather than chart by chart.
Bottom section: top movers, issues and recommended actions
This band turns the dashboard into a decision tool. It has three blocks, each in a fixed slot so the page looks the same every month.
Top movers. A table of the ten landing pages or query groups with the largest gain and the largest loss in the selected period. Filter it to a minimum volume so single-click noise is excluded. Set the minimum at a level that reflects meaningful traffic for your site, for example 50 clicks a month, and state that threshold on the page.
Issues. A short list of technical and indexation problems that crossed an alert level: a spike in crawl errors, a drop in indexed pages, a template failing Core Web Vitals. Each issue carries an owner and a status, so the list works as a task queue rather than a diagnostic log.
Recommended actions. Three to five items, each tied to one decision in the matrix. A good action reads “Refresh the 14 comparison pages losing position 4 to 8, owner: content lead, review date: next month.” It does not read “consider improving content quality.” If the dashboard cannot produce an action, the metric behind that block probably does not belong on it.
Naming conventions, filters and default date ranges
Small structural choices decide whether the dashboard survives a change of owner. Set these before building any charts.
Naming. Use the same label for the same metric everywhere. “Organic leads” should not appear as “SEO conversions” on one page and “Lead form submits” on another. Write a one-line definition for every metric in a notes panel at the bottom of the page.
Filters. Expose three controls only: date range, device and channel group. Every extra filter is a route to selective reading, and stakeholders will use it to find the view that supports their opinion.
Default date range. Set the default to the last full calendar month for executive views and the last 28 days for operational views. Do not default to “last 7 days” on an executive page, because one week is too volatile to read without context.
Comparison default. Compare against the previous period of equal length, and make year-over-year an explicit option. Seasonal retail and B2B lead patterns look like crises when measured against the wrong baseline.
Once these conventions are documented and agreed, the template becomes reusable. A new analyst can rebuild the page from the layout alone, and the numbers stay comparable from month to month.
Conclusion and Next Steps
Summary of the template and where to start this week
A useful SEO reporting dashboard is built backward from decisions, not forward from whatever data the SEO team can easily pull. Start with the three to five decisions a stakeholder must make each month, such as whether to fund a content refresh, reprioritize technical fixes or expand into a new market. For each decision, assign one leading indicator, one outcome metric and a threshold that triggers action. Any metric that does not support a decision comes off the page.
Agree the thresholds with stakeholders before the first report goes out. A target set after the numbers arrive will be read selectively. Mark each metric as either one the SEO team controls, such as crawl errors or indexed pages, or one it only influences, such as organic revenue or brand search volume. The second group reflects shared work across marketing, product and sales, and attribution from organic search to revenue has limits you should state openly.
Where to start this week:
Book 30 minutes with the person who funds SEO. Ask which two or three decisions they make each month that search data could inform.
Write each decision on one line. Add a leading indicator, an outcome metric and a provisional threshold beside it.
Remove every metric that does not sit next to a decision. Keep the list short, because each extra metric dilutes attention.
Build a single-page version in your existing tool. If stakeholders need a live view, Looker Studio is a common choice, and it can sit on top of Google Search Console and Google Analytics data.
Send the draft to one stakeholder. Ask what they would do differently after reading it, and revise until the answer is clear.
If you are still choosing the tools behind this template, a review of SEO tools can help you match software to your team size before you commit to a reporting stack. Start with the decisions, though. A dashboard that answers the right questions with fewer charts will serve stakeholders better than a comprehensive one they never finish reading.
Frequently Asked Questions
What is the best free SEO reporting dashboard template?
For most US teams, the best free option is a Looker Studio report connected to Google Search Console and Google Analytics 4. Both data sources are free, and Looker Studio costs nothing to use. Start with a template that has three rows: headline outcomes, trends and diagnostics. The template matters less than the decisions it supports. Choose one your team can keep maintained. If your reporting is small, a spreadsheet with a monthly export works too.
How often should I update an SEO dashboard for stakeholders?
Refresh the underlying data daily or weekly so the numbers stay current. Present it to executives monthly or quarterly. Operational views for the SEO and development teams can update weekly, which helps catch problems early. Executives rarely need more frequent summaries. More frequent updates tend to invite overreaction to normal fluctuation. Agree on the cadence before reporting starts.
Which metrics matter most to executives?
Executives usually care most about organic revenue or qualified leads. They also want the trend in non-branded clicks to priority pages, and any risk to that performance. Rankings and impressions are useful diagnostics, but they rarely drive decisions on their own. Each metric should map to a decision, such as whether to fund content or prioritize a technical fix. If a metric does not change a decision, leave it off the executive view.
Can I build an SEO dashboard in Looker Studio without coding?
Yes. Looker Studio uses a drag-and-drop interface and has native connectors for Google Search Console and Google Analytics 4. You will need to set up filters, calculated fields for non-branded traffic and date range controls. These are configured through menus, not code. Expect an afternoon of setup for a basic version. Setup takes longer if you need to blend several sources.
How do I show SEO value when organic traffic is flat?
Shift the conversation from traffic to outcomes. Look at organic conversion rate, leads or revenue from organic landing pages, and the share of non-branded clicks on priority queries. Flat traffic can hide strong gains in quality, so segment by page group and by conversion. Be open about attribution limits, because last-click reporting often undervalues organic search. Annotate known events, such as seasonality or algorithm updates, so stakeholders can read the trend correctly.
What should I do if Search Console and Analytics numbers don’t match?
Expect a difference. Search Console reports clicks from Google Search. Analytics counts sessions recorded and attributed to organic search. The two tools use different definitions and handle data differently. Check that date ranges, time zones and filters match. Then compare trends rather than absolute totals. Document the known gap in your dashboard notes, so stakeholders understand it is a definitional difference, not an error.
About the author
Tom Koh
Tom is the CEO of MediaOne, a leading digital marketing agency. He is a business-experienced SEO consultant as well as a Google Gold Search Expert serving the international community. He has consulted for MNCs like Canon, Maybank, Capitaland, SingTel, ST Engineering, WWF, Cambridge University, as well as Government organisations like Enterprise Singapore, Ministry of Law, National Galleries, NTUC, e2i, SingHealth. His articles are published and referenced in CNA, Straits Times, MoneyFM, Financial Times, Yahoo! Finance, Hubspot, Zendesk, CIO Advisor. Under his stewardship, MediaOne has won dozens of prestigious digital marketing awards.
Your website has 150 published articles. Some attract consistent organic traffic, others haven’t generated a meaningful visit in months, and several cover nearly identical…
Writing a good advertisement sounds simple until you have to create 15 different headlines, stay within character limits, communicate your product’s benefits, and make…
Verifiability matters more than speed when publishing AI-generated content. An AI content generator turns a short brief into draft copy, and its usefulness depends…