SEO Audit
Free White Label SEO Audit Tool: What Agencies Actually Get
You’ve found a potential SEO client, reviewed their website, and identified several problems worth fixing. Now you need a professional audit report that explains…
Most audit tools produce long reports of checks and health scores. What matters is whether a report says what to fix first and what it will change. In one 2026 study of over 100,000 sites, the median site scored 71/100, and only 6.8% earned an A.
Most people open an audit report, scroll past color-coded warnings, and fix whatever sits at the top. That habit wastes effort. Each section makes a different kind of claim, and each needs a different check. Reading the report well starts with knowing which claims matter for your website and which are noise.
Most tools share a similar structure: an overall health score, issues grouped by category, a page-level breakdown and recommendations. The score is the least useful part. The median site in a 2026 analysis of over 100,000 audits by Seomator scored 71 out of 100. Treat the score as a trend line for your own site, because each tool weights checks differently.
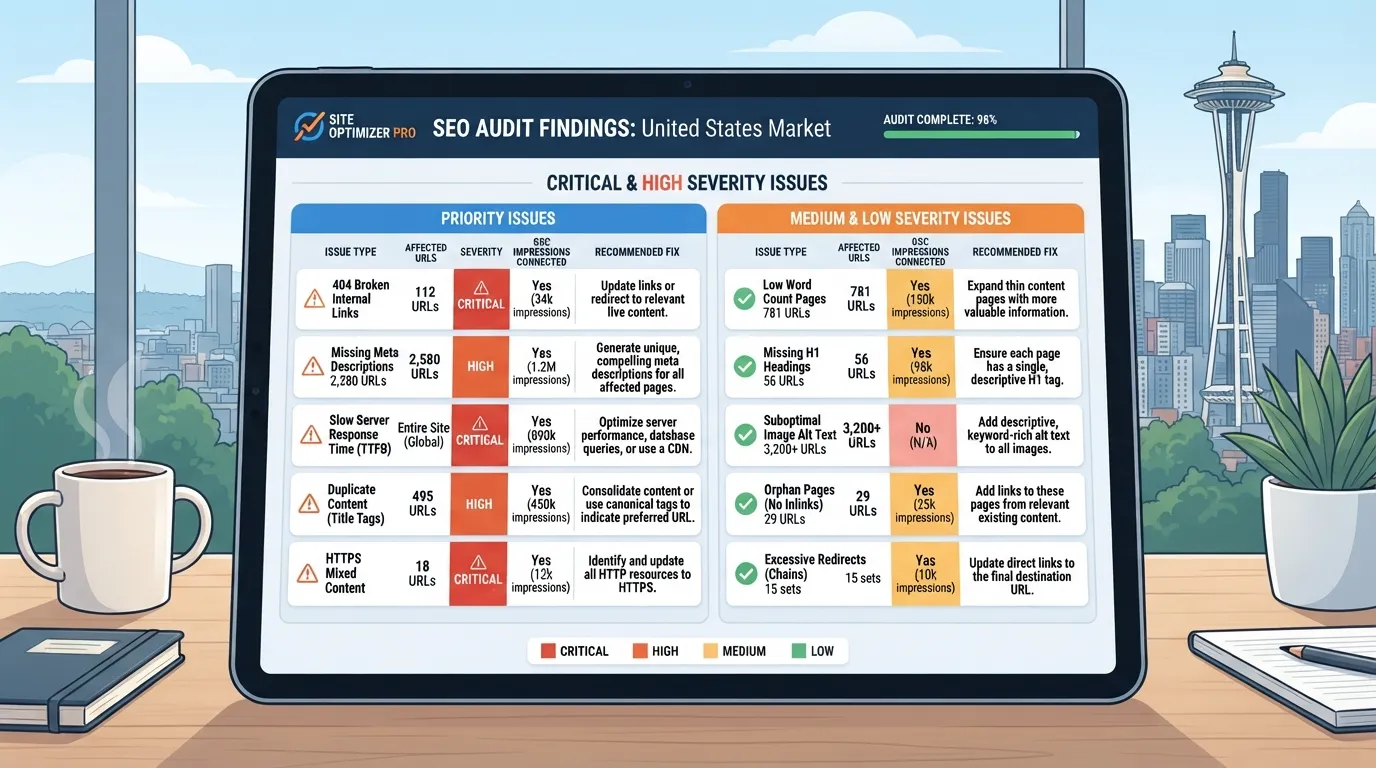
The issue list is where the work sits. Look for the affected URL count, the failed check and whether the report explains the fix. An issue flagged on 4,000 pages matters only if those pages are indexable and earn traffic. Duplicate content flagged across many URLs is a good example: confirm the duplicates actually compete before consolidating them. Check whether internal linking points search engines toward the pages you want to rank, since orphaned pages rarely earn traffic. A good site audit also highlights page speed, since slow pages can hold back otherwise strong content.
Labels such as “critical”, “warning” and “notice” reflect the tool’s judgment, not business impact. A missing meta description is often a warning, while a robots.txt block on a forgotten staging page may be critical. Before acting, ask whether the page receives organic sessions and which target keyword it supports.
| Label | What it usually signals | Check before acting |
|---|---|---|
| Critical | Blocks indexing or rendering | Is the affected URL meant to rank? |
| Warning | Weakens relevance or experience | Does the page get organic traffic? |
| Notice | Minor or best-practice gap | Is it worth batching with other fixes? |
Filter criticals by traffic. A critical error on a page with no impressions in Google Search Console matters less than a warning on your top landing page.
A crawl shows what the tool found when it visited your pages. It does not show what people search for, which pages rank or what they click. Confusing the two is the most common reporting error. A crawl may flag 300 thin pages, but if 280 receive no impressions, they are not measurably hurting your visibility.
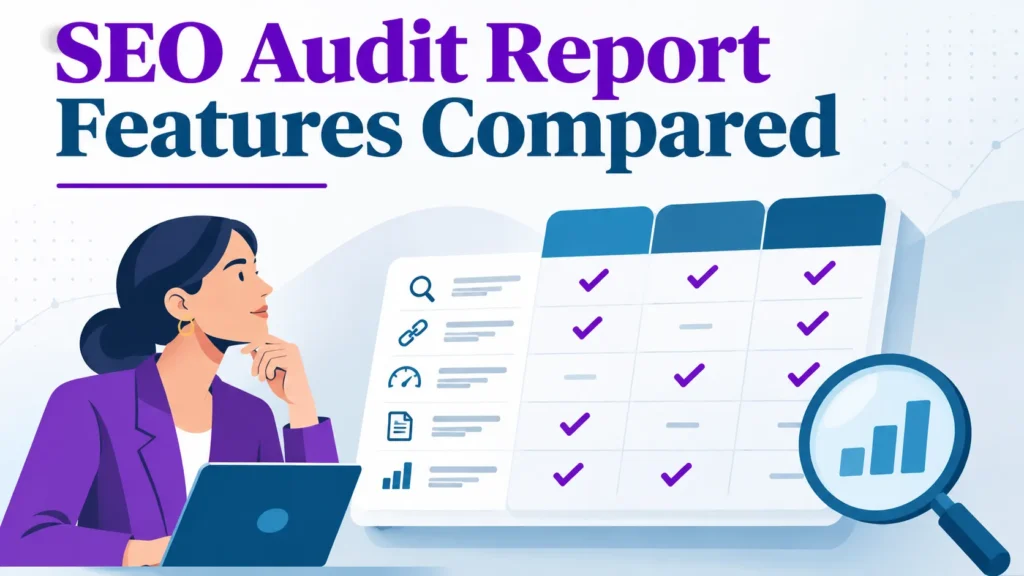
Use crawl data to find the problem and performance data to size it. This matters when you compare SEO audit report features across tools, since a report is only as useful as the data it can match against each finding. Crawler tools such as Screaming Frog surface the raw crawl, while audit tools like Ahrefs layer in performance metrics. Reviewing broken links and errors alongside traffic data shows which problems deserve attention first. The insights from pairing both data sets help separate real ranking blockers from cosmetic findings, and a thorough technical SEO review depends on that separation.
Most buyers compare SEO audit tools by counting checks. A better test is what the report does once it leaves the dashboard. The Audit Report Value Matrix scores each tool on five dimensions: issue depth, prioritization, remediation guidance, reporting output and integration. Each is rated from 1 to 5 on whether the report gives a specific next action, not on how many checks the tool runs. The best SEO audit reports also rank findings by their effect on the pages that matter most, so a report can separate a cosmetic warning from a loss in organic traffic.
| Tool | Issue depth | Prioritization | Remediation guidance | Reporting output | Integration |
|---|---|---|---|---|---|
| Semrush | 4 | 4 | 4 | 4 | 5 |
| Ahrefs | 4 | 3 | 3 | 4 | 4 |
| Screaming Frog | 5 | 2 | 2 | 3 | 3 |
| Sitebulb | 4 | 4 | 4 | 4 | 3 |
These scores are the editor’s judgment from the features described in this article, not measured results. Screaming Frog scores highest on raw depth but lowest on prioritization, which is why it needs a second tool to rank its output. Semrush scores highest on integration, which is why it suits teams that need an audit tied to search and traffic data and to keyword research that guides which pages to check first.
A useful audit report also has to show which flagged issues on your website matter most for the keyword and content you are targeting. Run each check against the pages that drive your organic results, not against the whole site, and treat technical SEO errors on those pages as the first priority.
The crawl ceiling limits a report more than any other setting. One widely used desktop crawler’s free version covers up to 500 URLs. Its paid license ($259 a year) removes that cap and unlocks JavaScript rendering, Google Analytics integration, Search Console connectivity and custom extraction, according to the vendor’s product page.
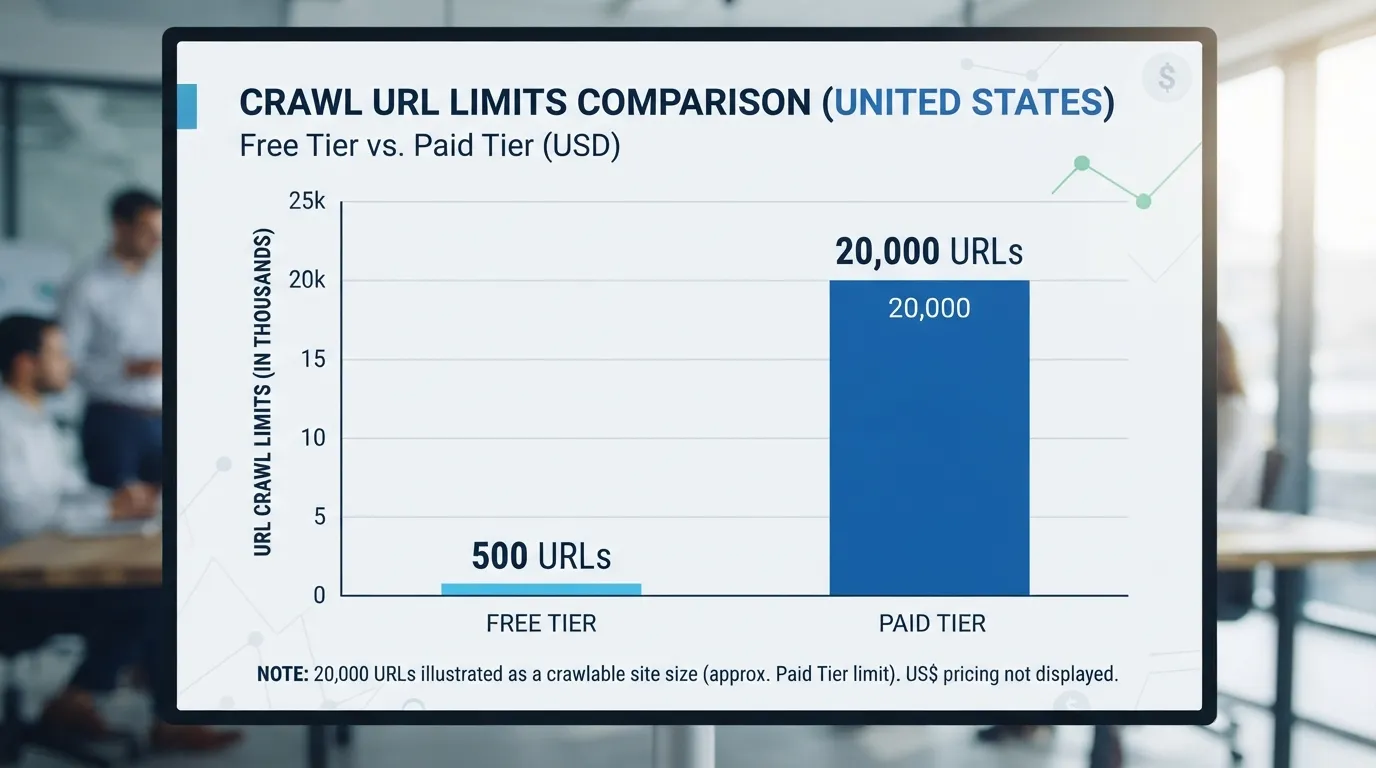
If the cap truncates the crawl, issue counts reflect only the pages the crawler reached. Check the ceiling before trusting the totals. Decision rule: if your site has more than 500 URLs, move to the paid license before you rely on any issue count.
Platform pricing works differently. As of 2026, Semrush plans start at $165 a month on Starter, with Pro+ at $248 and Advanced at $455, all billed annually. Compare effective monthly costs, and confirm current figures on each vendor’s pricing page. Checked 2026. Annual-billing discounts vary by vendor and tier, so verify before you budget.
Crawl depth is the second limit. One platform sets a 100-page default and lets you raise it for larger sites. Decision rule: on a 20,000-URL site, raise the depth before reading any score.
Rendering and integrations decide whether a report reflects what users and Google actually see. A crawl that does not render JavaScript can flag pages as thin when search engines see them fine. Rendering is usually a paid feature.
Integration determines whether an issue can be ranked by business impact. A Search Console connection shows impressions and clicks beside each flagged URL, and a GA4 connection shows which of those URLs earn conversions. Without those joins, every “critical” label is an opinion about markup, not a measured loss. Connected analysis of this kind is what turns raw insights into a ranking of fixes.
For US in-house teams, integration is the deciding factor. Weight it heavily if you report into Search Console and GA4, and confirm the connector is included in the tier you buy.
Benchmarking turns a to-do list into a relative position. One tool compares your site’s health against up to five competitor domains at once, per the same vendor’s product page.
Use benchmarking for prioritization. If a competitor shares your technical weaknesses, those issues may not explain your lost rankings. If a competitor is clean where you are not, that gap deserves attention first.
For agencies, the report is the product the client sees, so output format matters as much as detection. Look for branded PDFs, custom domains and exports the client can read without a login.
Pricing varies. One platform’s White Label plan starts at $39 a month. Another’s “Agency Unlimited” tier starts from around $99 a month, plus an $80 a month white-label domain fee, according to that vendor’s pricing page. Confirm both against live pricing pages before budgeting.
Before you commit, export a report for one real client site, hand it to someone outside the team, and ask whether they can tell what to fix and why it matters. If they cannot, the white-label feature is cosmetic.
Most audit reports cover these three areas, but they differ in depth. A flagged slow page helps only if the report says which metric failed, by how much, and what to change. Stronger reports surface the underlying issues and explain the root cause, so the findings guide a website fix rather than just issue a warning.
Core Web Vitals measure loading speed (Largest Contentful Paint), responsiveness (Interaction to Next Paint) and visual stability (Cumulative Layout Shift). Many crawlers report only lab estimates. Stronger reports also pull field data from the Chrome User Experience Report or Search Console, so you can see how real visitors experience your site.
When you compare tools, check:
JavaScript rendering affects these results, because many performance findings are invisible to a crawler that does not run scripts. Several tools treat rendering as a paid feature, so check this before you buy.
The core technical SEO checks are indexability (noindex tags, canonical conflicts, blocked resources), redirect chains and loops, and crawl depth. Most tools cover these, so the real difference is scale. A thorough site audit also flags duplicate content, since canonical conflicts often cause it. Review the content of duplicate pages before you consolidate anything.
Crawl depth is the biggest practical constraint. Ahrefs and Semrush both limit crawls by plan, so check the cap before you buy. A report built from a 100-page crawl of a 5,000-page site is a sample, not a full audit. Label the scope of any report you send a client.
Redirect checks need particular attention. A good report separates 301 chains, which dilute signals and slow crawling, from soft 404s, which return a normal status code but have no real content. Report broken links separately, with their source pages. Tools that group every redirect under one “warning” hide the real indexing problems.
Local checks are rarely a general crawler’s strength. They include NAP consistency (matching name, address and phone details across sites), Google Business Profile linkage and local schema markup. Confirm that a tool audits local signals before you assume it does.
WordPress-specific checks are more common. WordPress is used by 39.5% of all websites, according to W3Techs, and it has its own audit ecosystem. Many tools check for plugin conflicts, duplicate archive pages and thin tag or category pages. To compare fairly, run one audit on a WordPress site you already know and count how many of its real problems the report catches. Good audit tools make this comparison easier, since you can measure each report’s output against a site whose issues you already understand.
Most buyers choose an audit tool by counting its checks, which is the wrong test. A tool running 120 checks and ranking them by likely impact beats one running 300 checks in a flat error list. Ask whether each finding becomes a fix, a priority and a measurable result. The best SEO audit tools turn raw crawl data into decisions the team can act on.
Score tools with the Audit Report Value Matrix, rating five dimensions from 1 to 5: issue depth, prioritization, remediation guidance, reporting output and integration. Weight the total by who reads the report, then compare. A tool that surfaces the most serious errors on your website first, with findings tied to keyword and traffic data, gives you real analysis rather than a list of warnings. A strong site audit also maps internal linking gaps, so you can see which important pages receive too few links.
| Use case | Weight most heavily | Why |
|---|---|---|
| In-house team | Integration and prioritization | Data must sit alongside Google Search Console and GA4 |
| Agency (about 12 clients) | Reporting output and crawl ceiling | Client-facing PDFs and large-site coverage matter most |
| Freelancer | Remediation guidance and price | One person does the fixing, so clear steps save hours |
Site scale sets the crawl ceiling you need. The free version of one popular crawler covers up to 500 URLs, enough for a small brochure site but not a large catalog. A crawl that stops early produces a clean-looking but incomplete report. For a wider platform, read our guide to SEO tools.
Decision rule: if your site has more URLs than your free crawl ceiling, move to a paid crawler before you audit. Below that threshold, the free tier is enough for a health check.
Compare effective monthly cost on annual billing. As of 2026, Semrush plans start at $165 per month on Starter, $248 on Pro+ and $455 on Advanced, all billed annually and paid upfront. Standalone crawlers sit lower, with entry tiers from $39 per month. Count add-ons too: an $80 per month white-label domain fee can double the cost of a plan that looked cheap.
Prices below were checked on the dates shown. Annual-billing discounts vary by vendor and tier, so verify the current figure on each pricing page before you budget.
| Tool type | Entry price (2026) | Notes | Checked |
|---|---|---|---|
| Semrush | $165/month (annual) | Full suite, paid upfront | Verify on vendor page |
| Standalone crawler | From $39/month | White-label entry tier | Verify on vendor page |
| Agency plan | From $99/month + $80/month domain fee | White-label domain billed separately | Verify on vendor page |
The cheapest plan is the one with the crawl ceiling and export format you need. A standalone crawler suits a single technical audit. A full suite suits a team that also tracks rankings and competitors.
Repeat these steps each quarter. Changes in your prioritized task list tell you more than the raw issue count. Regular SEO audits, run on the same schedule, make trends visible that a single report can hide.
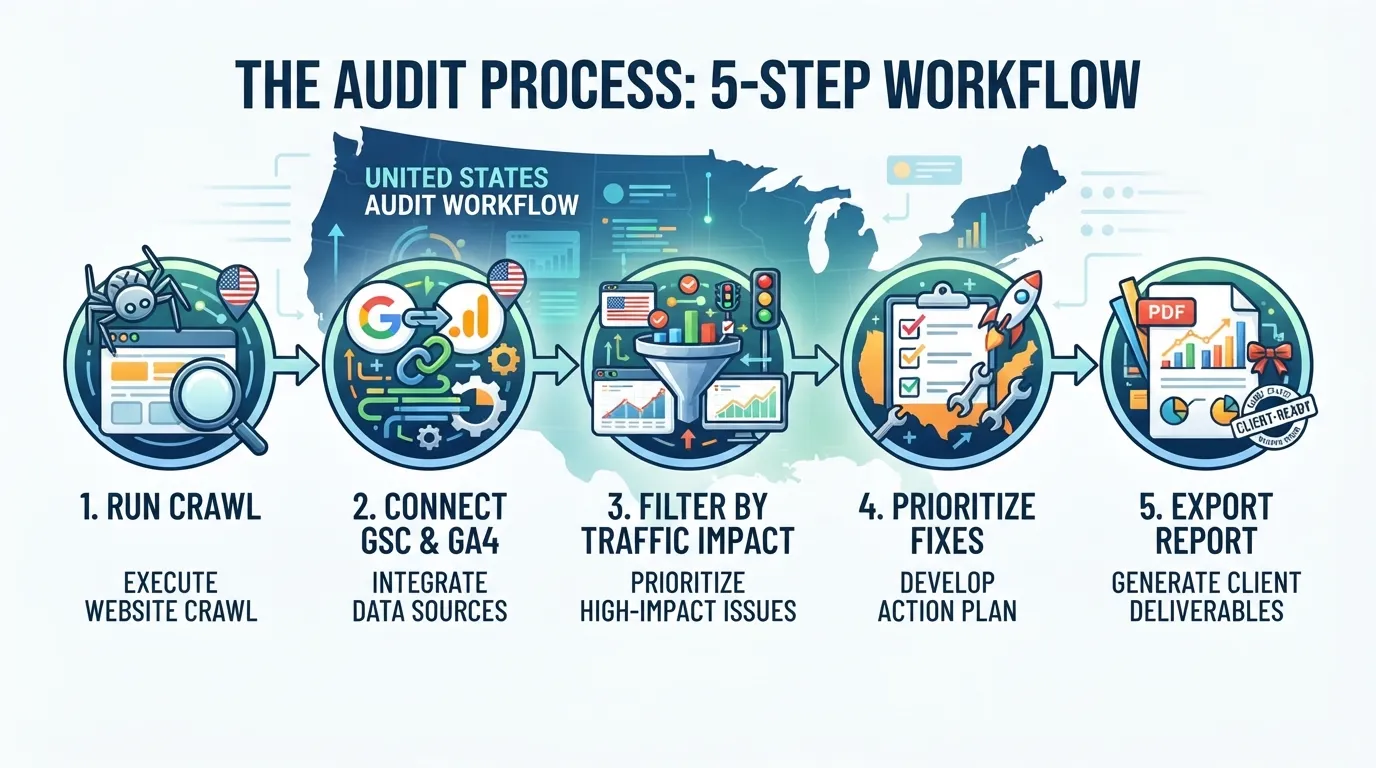
Choose the audit report that turns each finding into a fix, a priority and a measurable outcome. Score each tool with the Audit Report Value Matrix, weight the totals for your use case, and then run the free version on your own website before you commit.
Our recommendation: for a quarterly review, pick the tool whose remediation guidance you would trust a junior colleague to follow without a call.

Tom is the CEO of MediaOne, a leading digital marketing agency. He is a business-experienced SEO consultant as well as a Google Gold Search Expert serving the international community. He has consulted for MNCs like Canon, Maybank, Capitaland, SingTel, ST Engineering, WWF, Cambridge University, as well as Government organisations like Enterprise Singapore, Ministry of Law, National Galleries, NTUC, e2i, SingHealth. His articles are published and referenced in CNA, Straits Times, MoneyFM, Financial Times, Yahoo! Finance, Hubspot, Zendesk, CIO Advisor. Under his stewardship, MediaOne has won dozens of prestigious digital marketing awards.
Run a free Digimetrics audit across SEO, AI search, content and technical health, and get a plan you can act on today.
Start free →You’ve found a potential SEO client, reviewed their website, and identified several problems worth fixing. Now you need a professional audit report that explains…
Your website has hundreds of pages, organic traffic is declining, and you’re not sure what’s causing the problem. Is Google struggling to crawl important…
The best SEO software for a small business is not necessarily the product with the most features. It is the tool that tells you…