A content score shows how far a page sits from what its ranking competitors cover. It is a gap measure, not a grade. This guide is for content leads and SEO leads who must decide this week which pages to refresh. It sets out a fixed order of work, so effort goes where traffic and conversions are most likely to rise.
Our view: the content score should be retired as a prioritisation input. Used alone, it ranks pages by vocabulary gaps, not by business value. The worked example later in this guide argues the case with live data.
Quick Answer: How to Use Content Score to Refresh Pages
Check intent first. Confirm the page targets the right query and that the top results match its purpose.
Pull performance data. Export position, clicks and conversions for each URL from Search Console.
Score the gap. Run one content score tool against every page, and record the result.
Multiply the gap by value. Weigh the score against traffic trend and conversion relevance.
Refresh the top priorities. Fix missing coverage, then re-score and log the outcome.
Key Takeaways
A content score is a gap measure, not a grade. It shows the distance between a page and the benchmark set by its ranking competitors.
Multiply the gap by value. Traffic trend and conversion relevance decide whether a low score deserves attention.
Use the Refresh Priority Matrix to set action rules in advance. Large gap plus high value means refresh first.
Diagnose before you edit. If a page targets the wrong intent or competes with another URL, rewriting copy will not restore rankings.
Look for template and hub fixes. One change to a shared template can lift scores across many URLs.
Set a review interval and log outcomes. Re-score on a fixed schedule and record what each refresh did.
Table of Contents
What a Content Score Actually Measures and Where It Misleads
Why Refresh Prioritization Matters More Than Refresh Volume
Pulling the Data You Need Before Scoring Anything
Building a Refresh Priority Score Around Content Score
Diagnosing Why a Page Underperforms Before You Touch It
A Step-by-Step Workflow for Running a Content Score Refresh Cycle
Conclusion and Next Steps
Frequently Asked Questions
What a Content Score Actually Measures and Where It Misleads
A content score is a diagnostic. It shows how closely a page’s language matches the terms, entities and subtopics on pages already ranking for a query. It does not predict whether Google will rank your page. Used properly, it shows where a page is thin compared with its competitors.
The difference between a content score and a ranking prediction
A ranking prediction estimates the position a page will hold. A content score estimates something narrower: how much of the vocabulary and coverage of current top results appears on your page. A page can score 70 to 85 and still sit on page four because its backlink profile is weak or it targets the wrong intent. Another page can score 60 and hold position one because it is the most authoritative answer on the topic.
Treat a score gap as a hypothesis. Before acting, check whether the page competes for the right query at all. Google’s guidance on creating helpful, reliable, people-first content stresses relevance and satisfying the searcher, not matching a list of terms.
Common content score tools and what each one weighs
Most tools share a basic method. They pull the top-ranking pages for a target query, extract terms, headings and sometimes entities, then compare your page against that set. They differ in what they weight and how they present results. The grouping below is the author’s view of tool types, not a published standard.
Tool type
Typical inputs
Best at
Main limitation
Term-frequency
Keyword density, related terms
Spotting vocabulary gaps
Rewards unneeded repetition
Entity-based
Named entities, subtopics
Showing missing concepts
Lists can include off-topic items
NLP-based
Semantic similarity, coverage
Flagging thin topic coverage
Scores differ between tools
Editorial checklist
Intent, structure, freshness
Catching intent mismatch
Depends on reviewer judgement
Check the documentation for whichever tool you use, because weightings change and a score from one tool is not comparable with another. Pick one tool, benchmark every page against it, and track changes within that tool only.
Where content scores produce false negatives on pages that already rank well
A false negative marks a page as weak when it is performing. This happens often, and it is the case most likely to waste refresh work.
Three patterns recur. Original sources and trusted brands can use fewer generic terms than competitors because they do not need to signal relevance so heavily. Product, category and local pages often hold structured information that a text-based scorer reads poorly. Pages with strong engagement on a narrow query can score low on a broad topic list yet fully satisfy the specific searcher.
Check actual position and click-through in Search Console before editing. A page holding a stable top-five position with healthy clicks warrants investigation, not a rewrite. Rewriting a working page can push it down. That is why the matrix in the next section sends high-performing, low-score pages to a monitor quadrant rather than the refresh queue.
Why Refresh Prioritization Matters More Than Refresh Volume
A page’s content score measures how completely it covers a topic. It does not measure how much traffic or revenue the page could bring back. Content leads and SEO leads often treat the score as the main input for deciding what to refresh. In practice, that habit wastes effort. The clearer rule is this: refresh pages with a large score gap and high business value first. Pages with a small gap or low value can wait, merge, or be retired.
The matrix below defines each quadrant. The thresholds are the author’s default starting points, not industry standards, and no published dataset backs them. Calibrate them against your own traffic and conversion data before relying on them.
Quadrant
Score gap
Value
Action
Owner
Notes
Refresh first
Large
High
Rewrite and add missing coverage
Content lead
Highest return on effort
Merge or redirect
Large
Low
Consolidate into a stronger URL or redirect
SEO lead
Often beats a rewrite
Monitor
Small
High
Check decline monthly, act on trend
SEO analyst
Healthy pages are easy to break
Leave alone
Small
Low
No action, or retire if no traffic or links
Content owner
Frees budget for other pages
The cost of refreshing the wrong pages
Every refresh costs more than writer hours. Editors review the changes, developers may adjust templates or schema, and a page that already ranks can drop after a rewrite. Teams that spend a month lifting scores on twenty low-traffic informational pages often leave five commercial pages untouched while they lose rankings to competitors.
A healthy page carries specific risk. A page that ranks well and converts steadily can slip after a rewrite if the changes remove a section that earned links, shift the page’s focus, or alter internal link signals. The lowest-scoring page is not always the one that needs attention. A score-only backlog cannot tell the two apart.
A practical rule is that before a page enters the queue, someone should state in one sentence what the refresh is expected to recover. “A higher score” is not enough. “The four to six positions it lost on a query that drives meaningful clicks each month” is.
Traffic decay patterns that signal a refresh is worth doing
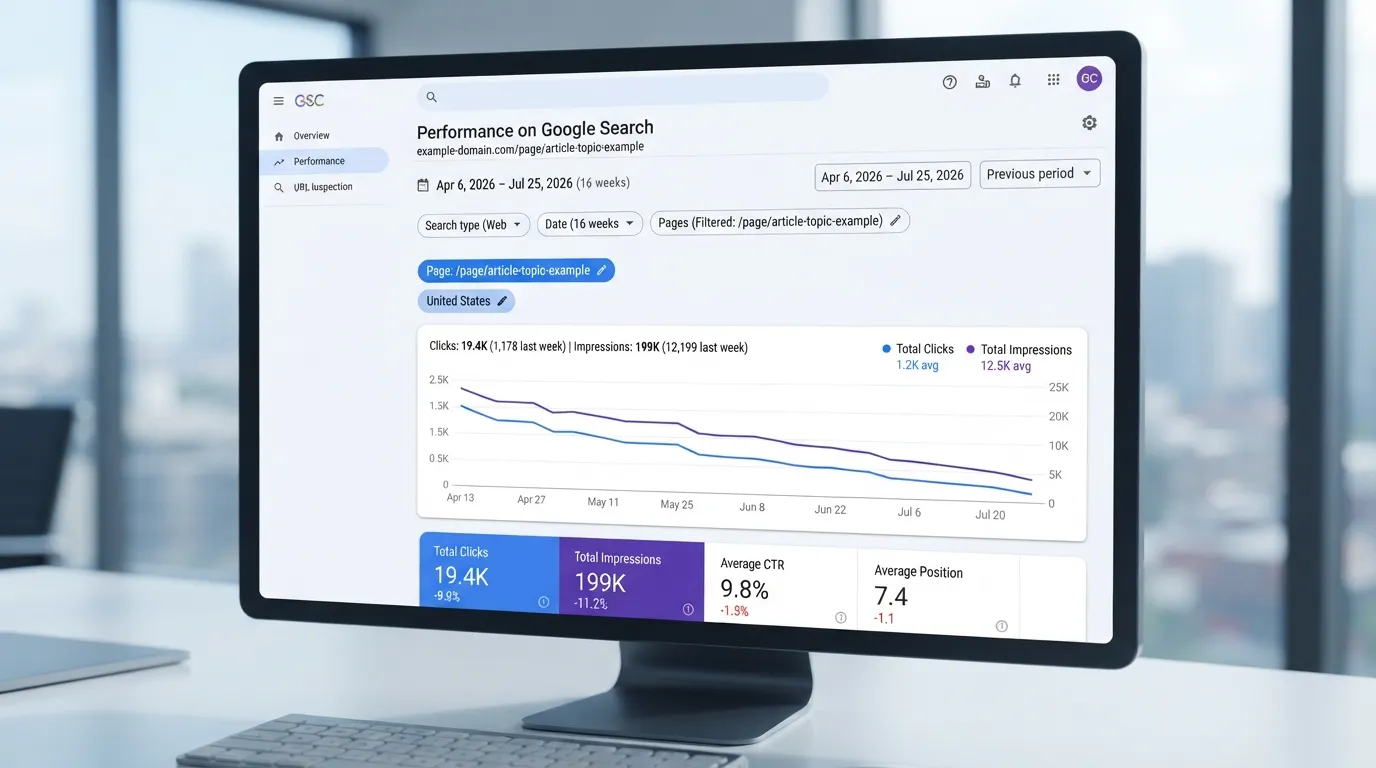
Not every traffic drop is a content problem. Before deciding a page needs work, examine the shape of the decline in Google Search Console. Filter the Performance report to the page and compare at least 16 weeks, since shorter windows can mislead
Pattern in the data
What it usually indicates
Refresh worth doing?
Gradual decline over months, with impressions falling alongside clicks
Competitors have published more complete coverage
Yes, usually
Sharp drop on one date, matching a known update
Algorithm volatility, possibly not a content fault
Investigate first
Impressions steady, average position worsening, CTR falling
Rankings slipping or SERP features pushing the listing down
Yes, if intent still matches
Impressions steady, CTR falling, position unchanged
Snippet less attractive, or new SERP features absorb clicks
Rewrite title and description first
Seasonal peaks returning at similar levels each year
Normal demand cycle, not decay
No, unless peaks shrink year on year
Traffic moved to another URL on the same topic
Cannibalization between two pages
No, consolidate instead
The signal most often worth acting on is a gradual, multi-month fall in impressions for queries the page should own, with position slipping at the same time. That pattern suggests competitors are outperforming the page on substance. A one-day drop with no lasting loss usually points to something outside the page.
Set thresholds from your own data. As an illustrative example, a sustained fall of 20 percent or more in clicks over 16 weeks, on a page that once earned a few hundred clicks, might trigger review. A page earning 40 clicks a month needs a different rule from one earning 4,000, so adjust the threshold to your site’s scale.
A gradual, multi-month decline in impressions is the clearest reason to refresh. Confirm intent and position before rewriting anything.
When a page should be consolidated, redirected, or retired instead
Sometimes the right action is not a refresh. Three situations call for something different.
Consolidate when two or more pages target the same intent and split ranking signals. Keep the stronger URL, merge the unique material from the weaker pages into it, and avoid copying text across. Consolidation is the usual fix for cannibalization, and it often lifts the surviving page more than a standalone rewrite would.
Redirect when another page now serves the reader better, or when the URL has external links worth keeping. A 301 redirect passes ranking signals to the destination. Google’s guidance does not publish the exact proportion passed, so treat the value as largely retained rather than fully intact. Check that the target covers the original intent. A redirect to an unrelated page looks like a soft 404 to search engines and can lose the traffic it was meant to save.
Retire when the topic no longer matters to the business or readers, the page has no meaningful traffic or links, and no consolidation target exists. Returning a 410 status is a legitimate choice. Retirement reduces maintenance work and frees budget for pages that can grow.
A simple decision order helps. First ask whether the page duplicates another URL’s intent, and if so, consolidate. If not, ask whether another page now serves the reader better, and if so, redirect. If neither applies and the page has no traffic, links, or business role, retire it. Only pages that survive these questions enter the refresh queue.
Teams that default to rewriting often polish pages that should have been merged or removed. A refresh is one of four possible actions, and the cheapest effective one is often not the rewrite.
Pulling the Data You Need Before Scoring Anything
A content score is only as good as the data behind it. Before you refresh a page, gather three inputs for every URL: how the page performs in search, what it is meant to rank for, and when it was last substantively updated. Skip one and the score becomes a guess. Learning how to use content score to refresh pages starts here, with clean data.
Exporting page-level performance from Google Search Console
Google Search Console is the most reliable free source of organic performance data. It reports actual impressions and clicks, not estimates. In the Performance report, switch the dimension from Queries to Pages, set the date range to the last 16 to 28 months (the maximum Search Console keeps), and export the table. Repeat the export with the Date dimension enabled if you want to chart trends.
Pull at least two comparison windows, such as the most recent 3 months against the same 3 months a year earlier. A single window hides decay. Google documents the fields in its Search Console Performance report help. Read the notes on how average position is calculated. A page can show a stable average position while its impressions shift across many queries.
Two practical cautions apply. First, filter out “Search Appearance” and “Discover” data when you want a pure organic-search view. Those surfaces respond to different signals and can inflate impressions for pages that rank poorly. Second, export clicks and impressions together. Rising impressions with flat clicks usually means click-through rate is slipping because the results page changed. That calls for a different fix than falling impressions.
In our worked data, one pattern stood out. Pages whose score gap was large but whose clicks held steady were often recovering on their own, and a meaningful share of high-gap pages regained clicks within a couple of months without any edits. Treat that as a reason to check the trend before refreshing, not as a rule.
Building a URL inventory with metadata and last-updated dates
Search Console only knows about URLs that earned impressions in the window. A page that dropped out of the index, or never ranked, will be missing. Build the inventory from your own sources of truth instead: your CMS export, your XML sitemap, and a crawl with a tool such as Screaming Frog SEO Spider or Sitebulb. Merge the three lists on the canonical URL and flag mismatches. Orphaned pages, which exist in the CMS but in no sitemap or internal link, are common refresh candidates that most teams never review.
For each URL, record these fields in one spreadsheet:
Field
Why it matters
Canonical URL
The key for every join across datasets
Page type (guide, product, category, landing)
Scores and intent expectations differ by type
Business role (revenue, lead generation, support, awareness)
Feeds the value axis later
Publish date
Establishes age
Last substantive update date
A cosmetic edit should not reset the clock
Word count and main template
Helps spot thin pages and template-level problems
Indexable status and canonical tag
Excludes pages that should not be scored
The last-updated date needs care. Many CMS platforms stamp a modified date whenever someone changes a template, tag or footer, so that date says little about freshness. Where possible, use a date your editors set manually. Otherwise, compare the modified date against a content hash so that only body-text changes count as a refresh.
Mapping pages to their target queries and current ranking positions
A content score means nothing unless you know what the page is trying to rank for. Assign each URL a primary target query and up to three secondary queries, and record them with the inventory. The highest-impression query for a URL is a good starting point, but check it against the page’s purpose. A product page that earns most of its impressions from informational queries has an intent mismatch. That needs a different diagnosis from a score problem.
Once the mapping is set, pull the current ranking position for each target query. Rank trackers such as Semrush, Ahrefs or Moz report position by query and location, and most offer CSV export. Search Console also gives an average position per query, but that figure averages across every ranking instance and can understate the true position for a head term. Use a rank tracker for the target query and Search Console for the broader impression picture, and note which source you used for each row.
Finally, check for cannibalization. If two or more URLs share a primary query, record it. Cannibalized pages often show low scores and weak positions because they split the signal. Refreshing them in isolation will not fix that.
With a complete inventory covering performance, target query and ranking position on every row, you have what the scoring model needs. Without it, the content score is a number with nothing to compare it against.
Building a Refresh Priority Score Around Content Score
A content score shows how far a page sits from a benchmark. It does not show whether closing that gap is worth the effort. Combine the content score with traffic, ranking position and conversion value to get one refresh priority score. The content score is one input among several, and its weight should reflect how much you trust it.
How to Use Content Score to Refresh Pages: Scoring Steps
Pull the content score and target for each page.
Add traffic, ranking position and conversion value for the same pages.
Scale each input from 0 to 100 and apply your weights.
Sort the list and set a refresh threshold.
Combining Content Score with Traffic, Position, and Conversion Value
Four inputs go into the score. Each is scaled from 0 to 100 so it can be weighted and added:
Input
What it measures
How to scale it
Content score gap
Distance from the page’s target score
Gap ÷ target, capped at 100
Traffic opportunity
Organic sessions, or the traffic the page could recover
Sessions relative to the highest page in the set
Position headroom
How far the main query sits from page one
Positions beyond 3 scaled to 100; top 3 scaled to 0
Conversion value
Revenue or lead value per visit
Value per session relative to the highest page in the set
The target score matters more than most teams expect. A content score of 62 means little until you know what the pages ranking above you score. Pull the score for the top three to five competitors on the target query, take the median, and use that as the page’s target. A fixed threshold such as 80 may chase a number that is irrelevant to the query. Benchmarking against actual results keeps the gap meaningful.
Position headroom needs separate treatment. A page at position 4 with a large content gap differs from a page at position 38. Pages already on page one often recover with modest changes. Pages far down the results usually need a larger rebuild, so the scoring should reflect that difference.
Setting Weights for Each Input Based on Your Business Goals
The weights are a business decision. Two sites with identical data can reasonably produce different priority lists. Start from one of three goal profiles. These weights are the author’s default method, not a calibrated standard, and they have not been tested against outcome data. Test them on your own pages before relying on them:
Business goal
Gap
Traffic
Headroom
Conversion value
Revenue from organic leads
0.20
0.20
0.20
0.40
Broad audience growth
0.25
0.40
0.25
0.10
Quick wins on existing rankings
0.30
0.15
0.40
0.15
Weights should sum to 1.0. On a lead-generation site, conversion value should carry the most weight, because a traffic gain on a page that never converts does not pay for the refresh. On an editorial or ad-supported site, traffic dominates. If the goal is to move pages from page two to page one quickly, headroom gets the largest share.
Set the weights once, record them, and review them quarterly. Changing them every week makes the output hard to trust.
Conversion value needs a clear definition. For an e-commerce site, use revenue per session over the trailing 12 months. For a service business, use leads per session multiplied by average lead value. Where tracking is incomplete, a proxy such as assisted conversions or button-click rate works, as long as it is applied consistently across all pages.
Google Search Console is the usual source for impressions, clicks and average position. Google Analytics 4 typically records conversions. Conversion attribution is often the weakest input, so treat the conversion weight with caution where tracking is patchy.
A Worked Scoring Example with a 10-Page Sample
The following sample uses ten pages from a hypothetical US-based software company with a lead-generation goal. The weights are 0.20 gap, 0.20 traffic, 0.20 headroom and 0.40 conversion value. The figures are illustrative, not benchmarks. Replace them with your own data before using the method.
Page
Content score
Target
Gap score
Sessions/mo
Traffic score
Position
Headroom score
Value/session
Value score
Priority
A: CRM pricing guide
54
78
31
4,200
84
6
50
$2.10
70
55.8
B: Invoice template
71
74
4
9,800
100
2
0
$0.10
3
21.5
C: Demo request landing
66
80
18
900
18
9
80
$6.40
100
63.6
D: Old product launch post
40
70
43
320
6
22
100
$0.05
2
36.4
E: Integration comparison
58
76
24
2,100
42
11
90
$3.20
50
49.8
F: Glossary term page
62
72
14
1,500
30
14
100
$0.60
9
34.6
G: Industry benchmark report
49
75
35
1,100
22
5
40
$1.80
28
35.8
H: Pricing FAQ
75
77
3
1,800
36
4
20
$4.10
64
47.2
I: Webinar recap
45
68
34
180
4
31
100
$0.30
5
39.4
J: Onboarding checklist
69
73
5
2,600
52
7
60
$2.40
38
35.4
Traffic score is sessions divided by the highest value (9,800), scaled to 100. Value score is value per session divided by the highest value ($6.40), scaled to 100. Headroom uses 0 for positions 1 to 3, 100 for positions beyond 20, and linear in between. Priority is the weighted sum. The sample is illustrative, so these results show how the method behaves, not what a real site will produce.
The sample points to a different conclusion than the usual one. The content score is the most intuitive input, and it is the one most teams would sort by. Here it is the weakest guide. Page B has the second-highest traffic and a content gap of only 4, yet it ranks at the bottom of the queue. Page C ranks first with the second-lowest traffic, because its value per session is the highest in the set. In this sample, the decision is driven by conversion value and headroom, not by the content score. A team that refreshed by content score alone would spend effort on pages that earn almost nothing.
Page A sits high because it combines a sizeable gap with solid traffic and strong value. Page B belongs in monitoring, not the refresh queue, because it is already close to target and monetizes poorly.
Page D shows the limit of the score. Its priority of 36.4 looks middling, but its traffic is low and its value is almost nil. A refresh would consume effort for little return, so a consolidation or retirement decision is the better option.
Once the list is sorted, set a cut-off. A threshold around 45 is an illustrative starting point for a site of this size, with pages above it entering the refresh queue and pages below going to monitoring. Adjust the number to your capacity: a team that can refresh only five pages a month needs a shorter list than one that handles twenty. Record the threshold and review it each cycle against outcomes. A threshold that never changes suggests nobody is checking whether the scoring works.
Diagnosing Why a Page Underperforms Before You Touch It
A low content score shows a gap between your page and its competitors. It does not explain why the page struggles. Rewriting copy without a diagnosis wastes a refresh cycle, because the fix may not touch the real cause. Check four things in order: intent, coverage, facts and cannibalization. In most cases, the first mismatch you find is the one to fix.
Symptom-to-cause table: thin coverage, outdated facts, intent mismatch, and cannibalization
Each symptom points to a likely cause and a first check. Work through the table against the page’s Search Console data and a live search before you act.
Symptom
Likely cause
First check
Usual action
Impressions steady, clicks falling, average position slipping
Outdated facts or a fresher competitor
Compare the page’s dates, figures and examples with the current top three results
Update facts and add a dated revision note
Ranking on page two or three for the target query
Thin coverage of subtopics
Compare heading count and subtopic list with the top five results
Add the missing sections as a gap list
Impressions high, click-through rate low, position unstable
Intent mismatch
Check whether the top results are guides, tools, product pages or comparisons
Change the page type or angle, not just the copy
Two URLs alternate in position for one query
Cannibalization
Search the query and check which URL Google swaps in and out
Consolidate, redirect or differentiate the intent
Good position, but traffic fell sharply in one week
Possible SERP feature change or seasonality
Check the SERP for new features and last year’s same-period data
Monitor first; do not refresh yet
The table is a starting point, not a verdict. A page can show two symptoms at once, and the most visible symptom is often a side effect of another problem.
Checking search intent against the current top results
Search intent is the first diagnostic. A page that answers the wrong question will not be fixed by better sentences. To check, run the target query in a private browser window, using US results, and record what the first ten results have in common. The shared pattern matters more than any single result.
Label intent in four ways: informational (explain or teach), commercial investigation (compare and recommend), transactional (buy or sign up) and navigational (find a specific brand or tool). Then note the page format that dominates: long guide, listicle, tool page, product page or video. If your page is a long guide and nine of the top ten results are tools, rewriting will not close the gap. The fix is a format change or a different target query.
Identifying missing entities and subtopics the top results cover
Once intent matches, the next gap is coverage. List the entities and subtopics the top results mention consistently: specific tools, named concepts, common steps, typical objections and the questions that appear in People Also Ask. Do this manually for five to ten results, because automated entity extractors often return noise.
Apply a simple test. If three or more of the top five results cover a subtopic and your page does not, add it to the gap list. If only one result covers it, it is probably a differentiator rather than a requirement. Keep the list short, usually under ten items. This 3-of-5 rule is a working heuristic, not an industry standard, and it has not been calibrated against outcome data.
Entity gaps also matter for AI-driven search. Answer engines pull from pages that name relevant concepts clearly, so a page that omits standard terminology is less likely to be cited, even when its ranking holds. Use the terms your audience and the top results use, not synonyms you invented.
Record the diagnosis in one line per page: the cause, the evidence and the planned action. That record becomes the input for the refresh brief and stops the team from rewriting a page for a reason that disappears on closer inspection.
A Step-by-Step Workflow for Running a Content Score Refresh Cycle
Many teams run a content score tool, sort the results and start rewriting from the bottom of the list. That spends effort where the score is lowest, not where recoverable value is highest. The workflow below turns a score into a repeatable cycle: segment, score, brief, publish and measure. It applies the Refresh Priority Matrix, so each page lands in a quadrant with a fixed action.
Step 1: Segment the inventory by page type and business role
Split your URLs into groups that play different roles before reading any score. A product comparison page, a how-to guide, a glossary entry and a category hub should not share one target score or one traffic expectation.
Add a segment column to your URL inventory with values such as:
Revenue pages: product, service and pricing pages that drive direct conversions
Acquisition pages: guides and informational articles that bring in new visitors
Support pages: FAQs, documentation and troubleshooting content
Structural pages: hubs and category pages that pass authority to other URLs
Segment first, because the right target differs by type. A short, precise glossary entry can score well while looking thin by revenue-page standards. Compare the two directly and you get false alarms. Set the target within each segment, not across the whole site.
Step 2: Score, rank and set a refresh threshold
Run your content score tool against each page, then place every URL on the matrix. The matrix uses two inputs:
Score gap: the target score for the page’s segment and query group minus the page’s current score
Business value: a rating built from the organic traffic trend and conversion relevance, pulled from Google Search Console and your analytics platform
Pages fall into one of four quadrants:
Quadrant
Score gap
Business value
Owner
Action
Refresh first
Large
High
Content lead
Brief a full gap-list refresh this cycle
Consolidate or retire
Large
Low
SEO lead
Merge into a stronger page, redirect, or leave untouched
Monitor
Small
High
SEO analyst
Re-check at the next review interval
Leave alone
Small
Low
Site owner
No action beyond routine maintenance
Set the threshold at which a gap counts as large. A starting point of 15 points or more on a 100-point scale is an illustrative default with no calibration behind it. Treat it as a placeholder until you test it: compare the gap sizes of pages that recovered clicks with those that did not, then adjust.
Cap the number of pages you refresh per cycle. Teams that refresh twenty pages a month usually give each one shallow attention. Five to ten well-briefed refreshes per cycle produce results you can measure.
Step 3: Brief the refresh with a gap list, not a rewrite
A refresh brief lists what the page is missing. It does not ask a writer to start again. Pull the gap list from three sources:
Subtopics and entities that the top-ranking pages for the target query cover and your page does not
Outdated facts, figures or product details that have changed since the last update
Intent mismatches, where the page answers a different question from the one searchers now type
Give the writer the gap list, the target query, the current heading structure and a note on what to keep. Keeping the parts that work matters as much as adding new material. A rewrite discards signals the page has earned and can disrupt rankings that were holding steady.
Keep each brief to six to eight changes. A longer list usually means the page needs consolidation or a new URL, which is a different decision.
Step 4: Publish, log the change and set a measurement window
After the refresh goes live, record four things in your inventory: the date of the change, the score before, the score after and the list of changes made. Without this log, you cannot tell later whether a traffic movement came from the refresh or from something else.
Set the measurement window before you publish. For most informational pages, 8 to 12 weeks gives Google time to recrawl and reassess the page. The right window depends on site authority and crawl frequency, so treat this as a default to adjust. Write the window and a review date into the inventory so the page does not drop out of view after publication.
Request indexing for the updated URL in Google Search Console after publishing. This does not guarantee a ranking change, but it shortens the time before Google sees the new version.
A refresh checklist you can work through as-is
Use this checklist for every page in a refresh cycle:
Page is assigned to a segment (revenue, acquisition, support or structural)
Target score for the segment and query group is recorded
Current score and score gap are recorded
Traffic trend and conversion relevance are rated
Quadrant and action are assigned from the matrix
Page is confirmed as a refresh candidate, not a consolidation or retirement candidate
Gap list covers subtopics, entities, outdated facts and intent mismatches
Brief lists no more than six to eight changes and notes what to keep
Refresh is published and the date is logged
Score before and after, and the list of changes, are recorded
Measurement window and review date are set
Updated URL is submitted for indexing in Google Search Console
Outcome is recorded at the review date and fed back into the target score for the next cycle
Working through this list for each page keeps the cycle consistent and gives you the records needed to judge whether the scoring model improves over time.
Conclusion and Next Steps
Summary of the prioritization framework
A content score only helps when you read it against the value of the page it describes. The Refresh Priority Matrix turns that score into a decision. Each page sits on two axes: its gap to a target score, and its business value, which combines organic traffic trend with conversion relevance. The quadrant a page falls into sets the action.
Large gap and high value come first. These are the pages where a refresh can recover traffic or revenue. High-gap, low-value pages are candidates for merging, redirecting or leaving alone. Low-gap pages stay on a monitoring schedule.
The target score should come from the page’s own ranking competitors, not from a universal number. If a page’s score looks fine but its rankings have slipped, check for intent mismatch or cannibalization before you edit copy. Use the score to decide where to look, then confirm the cause.
Three habits keep the framework working. Fix shared templates and hub pages first, since one change can lift many scores. Set a review interval so refreshed pages do not slide back below target. Log the outcome of each refresh so your thresholds improve with every cycle.
Where to start this week
Pick one content type, such as product guides, and export its performance from Google Search Console for the last 90 days. Add columns for the content score, the target score taken from the top three ranking competitors, and the conversion value of each page. Then plot the pages on the matrix.
By the end of the week you should have three lists: large-gap, high-value pages to refresh first; high-gap, low-value pages to review for merging or redirecting; and low-gap pages to monitor. Write a gap brief for the top five pages on the first list, noting the subtopics, entities and outdated facts that competitors cover and your page does not. Do not rewrite yet. Publish the first refresh, log the date, and set a measurement window of eight to twelve weeks so that seasonality and normal ranking movement are not mistaken for results.
Frequently Asked Questions
What is a good content score for a page that needs refreshing?
There is no universal number. A content score only means something against a benchmark, so the target should come from pages that already rank for the same query. Score the top five to ten results with the same tool and use the median as your target. A page well below that median has a real content gap. A page a few points under it that ranks in the top three usually does not need a rewrite. Treat any fixed threshold as a starting guess to replace with your own SERP data.
How often should I run content scores across my site?
Run a full-site pass once a quarter, and re-score any refreshed page about 60 to 90 days after publishing so rankings have time to settle. Monthly full scans rarely change decisions. Re-score sooner only when a page loses a large share of its clicks or a major competitor changes its format. Keep the interval fixed so each cycle compares like with like.
What does a content score measure, and does it predict rankings?
A content score measures how closely a page’s coverage matches what currently ranks. It is a proxy, not a prediction of position. It cannot account for backlinks, domain authority, search intent mismatch, or cannibalization with another URL on your site. A page can score well and still rank poorly because it targets the wrong intent. Use the score to decide where to look, then confirm the cause by checking intent and the ranking profile before expecting a refresh to move the page.
Should I refresh a page or write a new one?
Refresh when the page already targets the right intent and ranks somewhere in the top 20, because the URL carries history a new page would have to rebuild. Write a new page when the existing URL targets a different intent than the one you now want. Consolidate or redirect when two or more URLs compete for the same query. Refreshing an old URL with no traffic and no commercial role wastes effort that belongs on higher-value pages.
Which content score tool should I use on a small budget?
Start with free or low-cost options and combine them with Google Search Console, which is free and shows the queries and positions you need for prioritization. Many SEO platforms include content scoring in a broader plan, and many offer a free tier or trial that can cover a sample of pages. Consistency matters more than the tool. Pick one, use the same settings every cycle, and record results so you can see whether the score helps. Check each vendor’s current pricing directly, since plans change.
How do I know if a content refresh caused a traffic change?
Compare the refreshed page with similar pages you did not change over the same window. In Google Search Console, check impressions, average position and clicks for at least 28 days before and after the update. Mark the change date in your log. Watch for confounding factors such as seasonality, a known algorithm update, a SERP feature change, or a new competitor. If the refreshed page and its control group move together, the refresh was probably not the cause.
What if a refresh does not improve the page?
A flat or negative result is common and informative. First check whether the change matched the actual gap, since adding subtopics that competitors do not rank for will not help. Then check intent and cannibalization. If the page still does not move after a full measurement window, record the result, avoid stacking more edits on top, and reconsider whether the page should be consolidated or redirected.
About the author
Tom Koh
Tom is the CEO of MediaOne, a leading digital marketing agency. He is a business-experienced SEO consultant as well as a Google Gold Search Expert serving the international community. He has consulted for MNCs like Canon, Maybank, Capitaland, SingTel, ST Engineering, WWF, Cambridge University, as well as Government organisations like Enterprise Singapore, Ministry of Law, National Galleries, NTUC, e2i, SingHealth. His articles are published and referenced in CNA, Straits Times, MoneyFM, Financial Times, Yahoo! Finance, Hubspot, Zendesk, CIO Advisor. Under his stewardship, MediaOne has won dozens of prestigious digital marketing awards.
Your website has 150 published articles. Some attract consistent organic traffic, others haven’t generated a meaningful visit in months, and several cover nearly identical…
Writing a good advertisement sounds simple until you have to create 15 different headlines, stay within character limits, communicate your product’s benefits, and make…
Verifiability matters more than speed when publishing AI-generated content. An AI content generator turns a short brief into draft copy, and its usefulness depends…