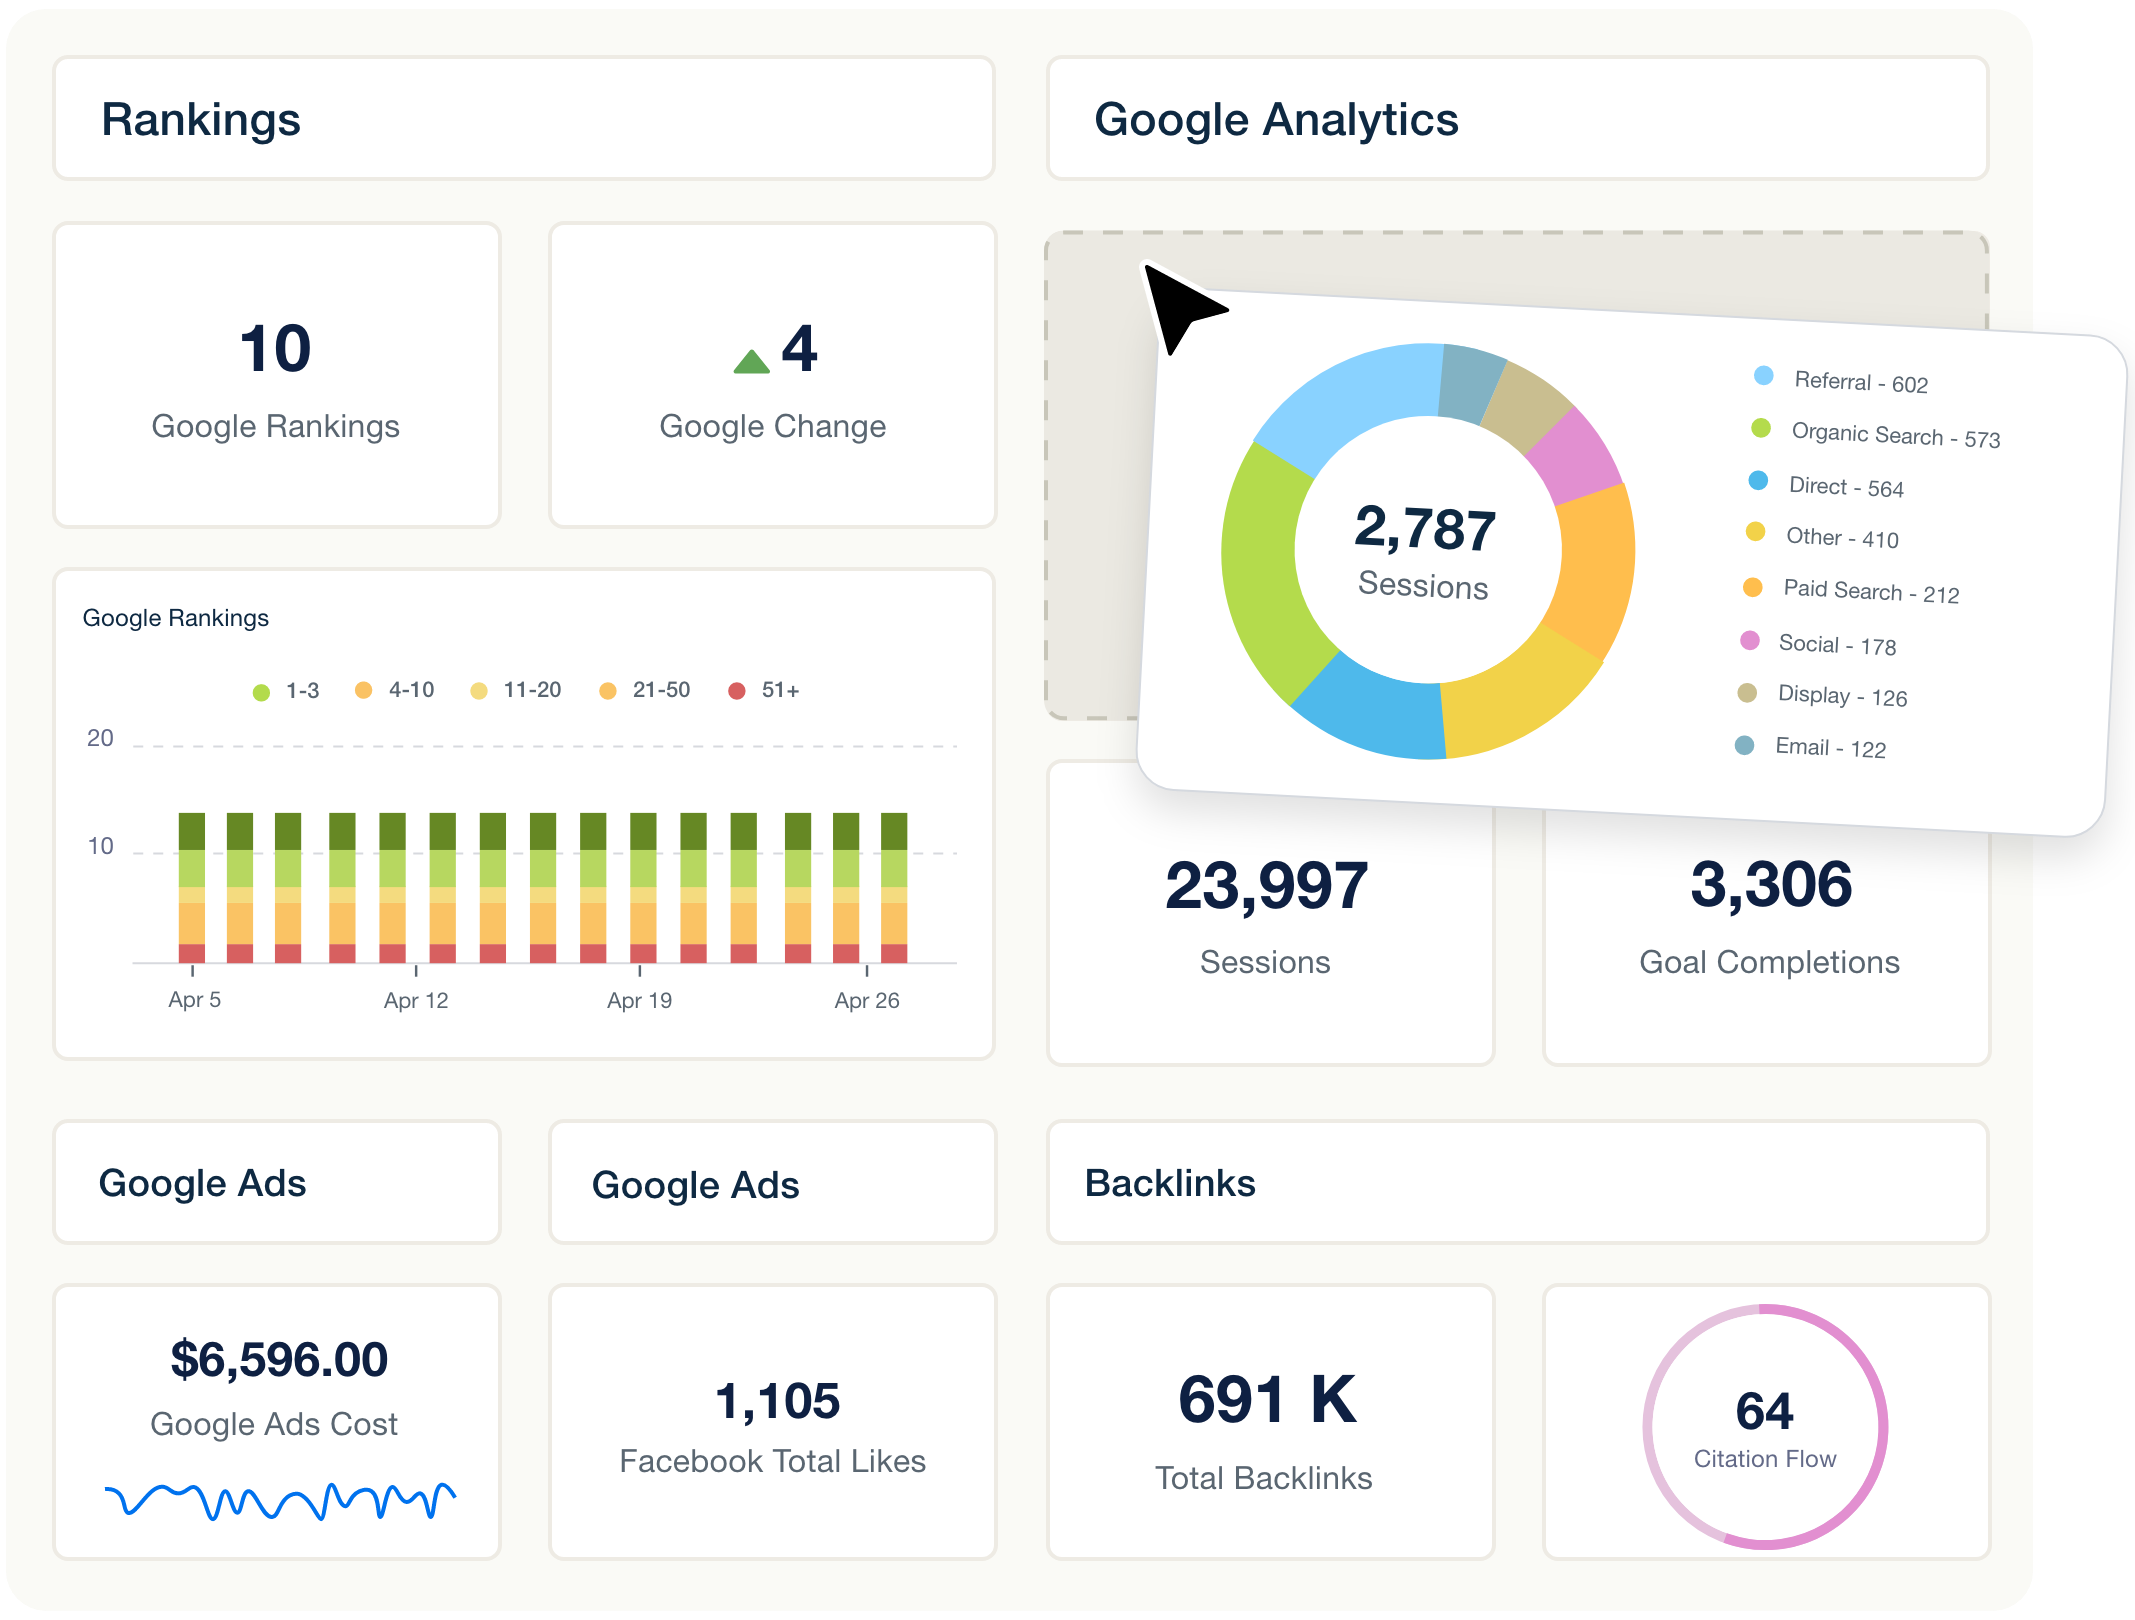
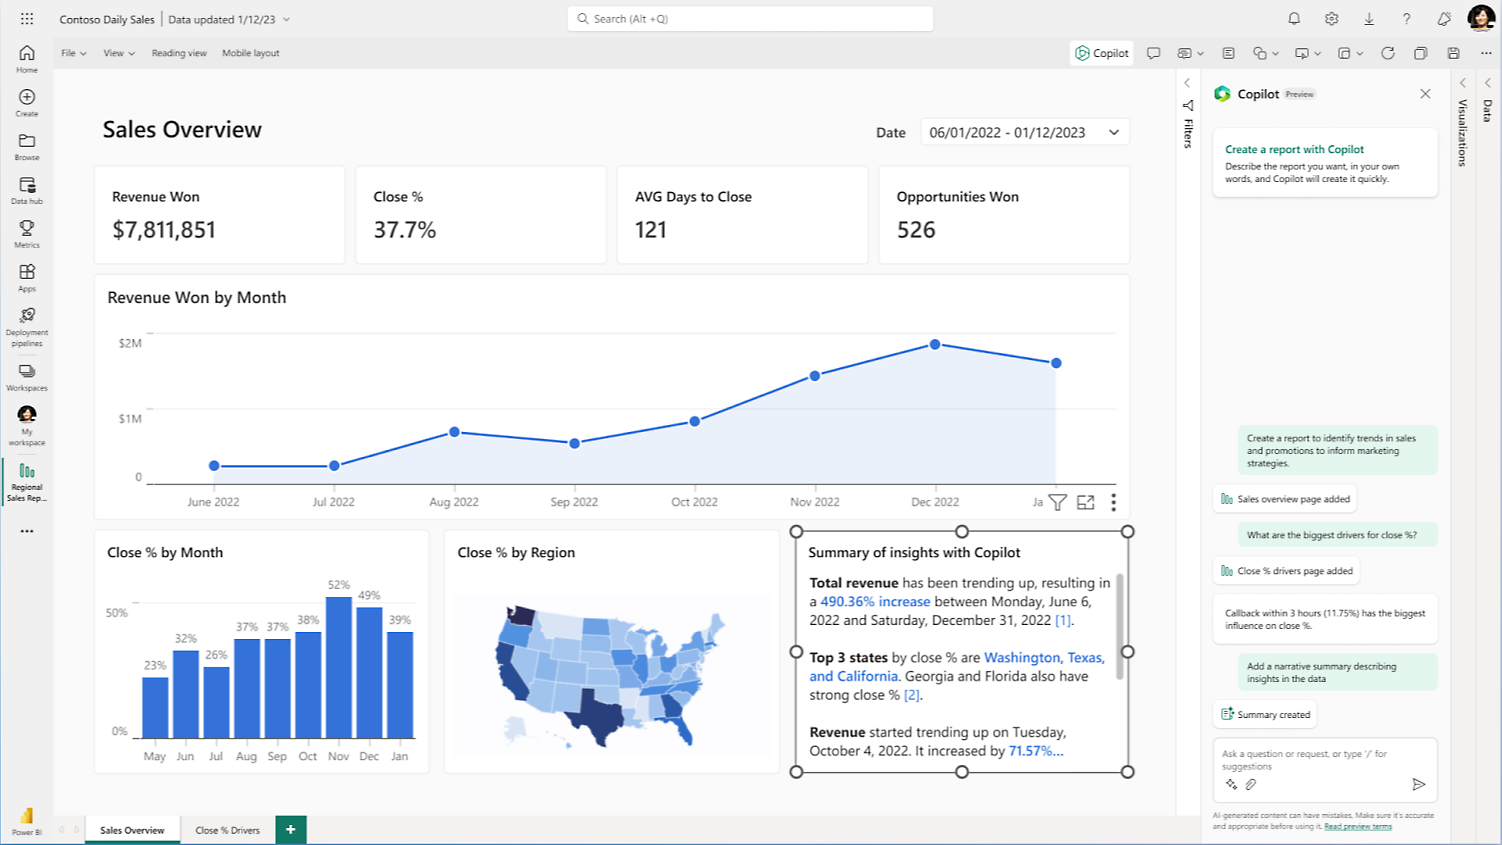
Your marketing dashboard has 27 charts, six connected platforms, and a colour-coded performance summary.
It updates automatically every morning. Your team spent weeks getting the data sources to work, and the report looks professional enough to present to the board.
There’s just one problem. Nobody does anything with it.
The CEO asks whether marketing is producing profitable growth. The marketing manager wants to know why acquisition costs increased. The paid media specialist needs to identify which campaigns deserve attention.
The dashboard has the data to investigate those questions, but finding the answers requires opening several tabs, comparing different reports, and rebuilding the analysis in a spreadsheet.
That’s what makes so many marketing dashboards ineffective. They’re designed around the information available rather than the decisions people need to make.
The solution isn’t necessarily another analytics platform or a more sophisticated visualisation.
It’s a reporting hierarchy that puts business outcomes first, explains meaningful changes second, and provides enough supporting evidence for someone to decide what happens next.
In this guide, we’ll show how to build marketing dashboards that people actually use, including which metrics belong on the executive summary, how to organise channel reporting, where automation helps, and how to assess dashboard software without paying for unnecessary features.
We’ll also compare common tools, examine published pricing, and introduce a practical framework for measuring whether a dashboard is delivering any value.
Research disclosure: This guide combines reporting-design recommendations with publicly documented software capabilities and pricing reviewed in November 2026. For a separate hands-on software comparison, see our eight-tool marketing dashboard benchmark.
A useful marketing dashboard answers three questions in the right order:
What changed? Which business outcome or important metric moved against its target?
Why does it matter? Is the change large enough, reliable enough, and commercially important enough to investigate?
What should we do? Who needs to take action, and which supporting information will help them decide?
A dashboard showing website traffic increased by 18% answers only part of the first question.
It doesn’t establish whether the traffic generated qualified leads, whether acquisition costs increased, or whether the business should invest more in the channel.
Those questions require context.
Reporting activity vs reporting decisions
Dashboard Shows
Better Reporting Question
Possible Decision
Website sessions increased 18%
Did qualified enquiries increase as well?
Invest in the pages attracting valuable visitors
Google Ads conversions increased 12%
Did sales-qualified leads increase at a sustainable cost?
Scale, hold, or refine campaigns
Organic impressions decreased 9%
Which commercially important pages lost visibility?
Investigate affected pages and search demand
Email open rate increased
Did recipients generate meaningful downstream activity?
Evaluate the offer and conversion journey
Social engagement doubled
Did the activity reach relevant customers?
Continue the format or change audience targeting
Cost per lead increased 20%
Did lead quality or downstream conversion compensate?
Investigate acquisition costs before changing budgets
The objective isn’t to eliminate performance metrics. It’s to arrange them so readers understand what each figure contributes to the business decision.
A good dashboard should make the most important issue visible without requiring someone to interpret every chart on the page.
The Three-Layer Marketing Dashboard Framework
Different people need different reporting details.
An executive shouldn’t have to navigate a campaign-level keyword table to understand whether marketing is performing.
Likewise, a paid media specialist needs more information than a monthly revenue total.
The most effective structure is to separate reporting into three layers.
Reporting Layer
Main Audience
Key Question
Appropriate Detail
1. Executive summary
CEO, CFO, board, marketing director
Are we achieving the intended business outcomes?
A few meaningful KPIs, targets, changes and decisions
2. Channel performance
Marketing managers, channel leads
Which channels are improving or underperforming?
Channel contribution, efficiency, trends and exceptions
3. Diagnostic analysis
Analysts, SEO specialists, paid media managers
What explains the change, and what can we do?
Campaigns, landing pages, audiences, events and source-level data
These layers should be connected, but they don’t need to appear on the same screen.
An executive can start with a concise summary and open supporting analysis when necessary. A specialist can investigate more detailed information without cluttering the board-level report.
This structure also reduces a common reporting problem: every stakeholder requesting additional charts until the dashboard becomes impossible to scan.
Layer 1: The Executive Marketing Dashboard
The executive dashboard should focus on outcomes, not marketing activity.
For most businesses, the first screen should explain whether marketing is contributing to the commercial goals agreed for the reporting period.
That might include revenue, qualified demand, acquisition cost, budget performance and customer retention.
But the exact metrics depend on the business model.
A B2B software company with a six-month buying cycle should not use the same executive scorecard as an ecommerce store with daily purchases.
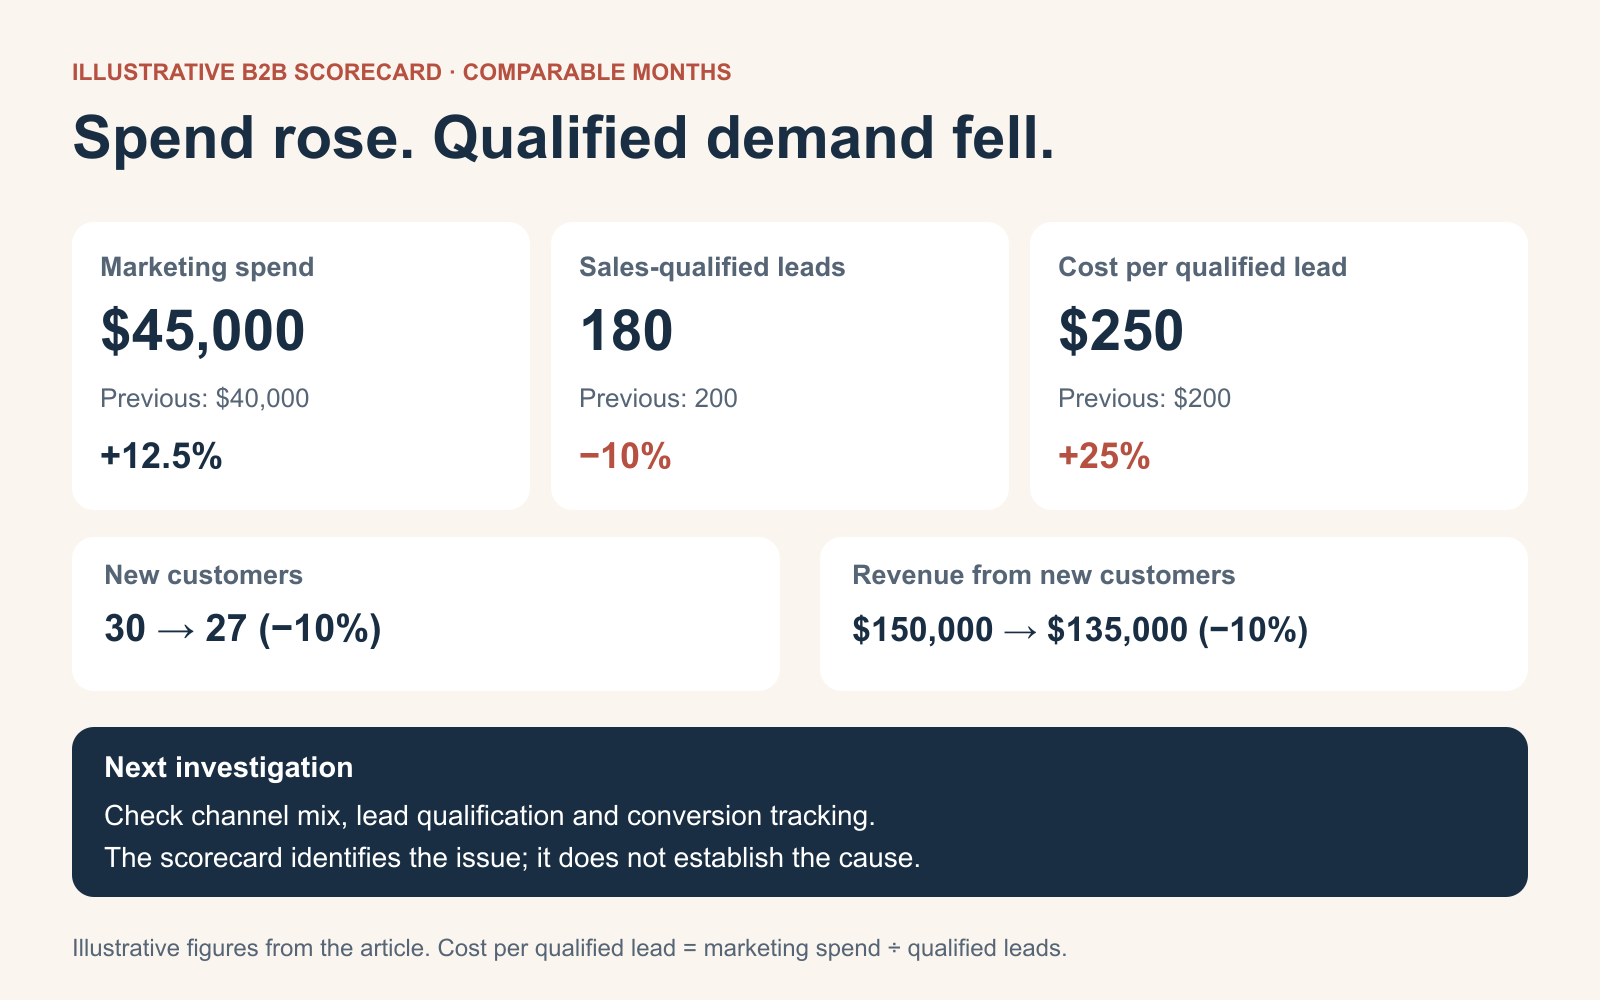
Example: A monthly executive scorecard
Consider a hypothetical B2B company comparing two reporting periods.
KPI
Previous Month
Current Month
Change
Interpretation
Marketing spend
$40,000
$45,000
+12.5%
Higher investment
Sales-qualified leads
200
180
-10.0%
Fewer qualified opportunities
Cost per sales-qualified lead
$200
$250
+25.0%
Acquisition efficiency deteriorated
New customers
30
27
-10.0%
Customer acquisition declined
Revenue from new customers
$150,000
$135,000
-10.0%
Lower recorded new-customer revenue
Illustrative figures, not actual campaign data. The cost-per-qualified-lead calculation divides the listed marketing spend by recorded sales-qualified leads. The periods are assumed comparable.
A conventional marketing report might begin with the fact that spending increased.
A decision-focused report would lead with the more important finding:
Acquisition efficiency worsened: spending increased 12.5%, while sales-qualified leads fell 10%, raising the cost per qualified lead by 25%.
That statement explains the issue faster than five separate charts.
The next step is to determine where the deterioration occurred, whether lead qualification or reporting changed, and whether the trend is reliable enough to justify intervention.
What belongs above the fold?
For most executive dashboards, start with four to six measures linked to the current business priorities.
Each should show its current value, comparison, target and reporting period.
Avoid choosing metrics simply because they are easy to collect.
For example, website sessions may be useful as a supporting metric, but if the executive’s primary concern is customer acquisition, traffic should not receive more prominence than qualified leads or acquisition cost.
Use an exception summary to highlight the two or three issues requiring attention.
If performance is broadly on plan, say so. A report doesn’t need to invent a problem every month.
Layer 2: Channel Performance Reporting
The second layer explains where performance is changing.
This is where marketing managers compare paid search, paid social, organic search, email, referrals and other channels.
The purpose is to identify which channels deserve further investigation—not to declare winners using metrics that aren’t comparable.
A channel scorecard is particularly useful when spending decisions are made weekly or monthly.
However, the dashboard shouldn’t encourage marketers to reallocate budget based on small changes or short time windows without examining the underlying data.
For paid media, our advertising performance metrics guide explains why CPC, CPA, conversion rate, ROAS and customer acquisition cost need to be interpreted together.
Layer 3: Diagnostic Dashboards
The diagnostic layer is where specialists investigate the problems identified above.
Suppose the executive dashboard shows acquisition costs increased.
The channel dashboard indicates that most of the deterioration is associated with paid search.
The paid media specialist can then inspect campaign-level spending, conversion rates, audience changes, landing pages, search terms and auction conditions.
The reporting sequence becomes:
Business outcome → affected channel → supporting evidence → possible action.
This is much more useful than making every executive scroll through advertising keywords and GA4 event tables.
Example: Investigating a cost-per-lead increase
A useful diagnostic dashboard could show the following:
Investigation
What to Check
Why It Matters
Spending
Did spend rise faster than qualified conversions?
Establishes the efficiency problem
Traffic costs
Did CPC increase?
Identifies possible auction pressure
Conversion rate
Did fewer visitors become qualified leads?
Points toward the offer, audience or landing page
Lead quality
Did CRM acceptance rates change?
Distinguishes weak leads from measurement changes
Landing pages
Were there errors, slower pages or changed offers?
Identifies conversion problems after the click
Tracking
Did the conversion definition or tag implementation change?
Helps detect false performance changes
The dashboard should link to the underlying records or provide a reliable way to inspect them.
A chart that shows an anomaly but gives no path to investigate it isn’t a complete decision-support workflow.
The Marketing Dashboard Layout We Recommend
For a dashboard intended for a weekly leadership meeting, we’d use the following structure.
Section 1: Business performance
Show the primary business outcomes, current period, target and comparison.
Include a data freshness timestamp so users know whether they are looking at complete or partially updated information.
Section 2: What changed
Highlight only the most material changes.
For each, include the size of the change, the affected metric and why the issue matters.
Avoid automatically describing every movement as positive or negative. An increase in acquisition cost, for example, may be acceptable if customers are becoming substantially more valuable.
Section 3: What needs investigation
Show the affected channel or business process and link to the diagnostic information.
Distinguish a confirmed cause from a plausible explanation that still needs testing.
Section 4: Decisions and owners
Include a short record of the actions agreed during the review.
A useful format is:
Finding
Next Action
Owner
Review Date
Qualified lead cost increased
Audit landing-page conversion and lead quality
Paid media lead
Next weekly review
Organic enquiries declined
Examine affected commercial landing pages
SEO lead
Next weekly review
Reporting discrepancy identified
Reconcile CRM and ad-platform conversion definitions
Marketing analyst
Before month-end close
Section 5: Definitions and caveats
Provide access to metric definitions, data sources, reporting windows and relevant limitations.
This information doesn’t need to dominate the dashboard, but readers should be able to find it.
A report that survives a board meeting needs a defensible explanation of where its numbers came from.
The Most Important Marketing Dashboard Metrics
There is no universal set of KPIs for every organisation.
However, the following categories provide a useful starting point.
KPI Category
Example Metrics
Appropriate Business Context
Revenue and profitability
Revenue, gross margin, contribution margin
Ecommerce and revenue-focused reporting
Customer acquisition
New customers, CAC, customer conversion rate
Businesses with measurable acquisition
Qualified demand
Sales-qualified leads, opportunities, pipeline value
Budget pacing, reporting freshness, unresolved data issues
Marketing management and governance
A KPI should have a clear definition, owner and intended use.
If nobody can explain what a metric means or what action it might influence, it probably doesn’t belong on the executive summary.
Avoid the vanity-metric trap
Impressions, clicks, sessions and followers aren’t useless.
They help diagnose campaign performance and audience behaviour.
But they shouldn’t automatically be treated as evidence of business success.
For example, an increase in organic sessions might reflect growth in informational traffic with little commercial intent.
A dashboard that celebrates the traffic increase without showing what visitors subsequently did may encourage the wrong decisions.
Use targets carefully
A dashboard showing actual performance against a target is generally more useful than one showing only historical change.
However, targets should reflect real business economics and capacity.
A lead-generation team shouldn’t set a lower cost-per-lead target without considering whether cheaper leads produce qualified opportunities.
Similarly, a retailer shouldn’t set a ROAS target without considering margins, returns and repeat purchasing.
The Metric Dictionary: The Part Most Dashboard Projects Skip
Before building visualisations, agree on what the metrics mean.
This sounds administrative, but it prevents a surprisingly common source of confusion.
Marketing may define a lead as anyone completing a form.
Sales may define a qualified lead as someone matching specific buying criteria.
Finance may report revenue only after a transaction is completed, while the advertising platform reports attributed conversion value.
If those definitions are mixed together, the dashboard can become misleading even when every connector is technically working.
Example metric dictionary
Metric
Definition
Source of Record
Refresh / Qualification
Marketing spend
Media and agreed campaign-related costs for the period
Finance records and ad-platform data
Reconcile at month-end
Sales-qualified lead
Lead accepted using agreed sales criteria
CRM
Depends on sales review
New customer
Customer meeting the company’s new-customer definition
CRM or order system
Excludes duplicates and cancellations as defined
Attributed revenue
Revenue credited under a named attribution method
Attribution or ad platform
Not equivalent to incremental revenue
Organic conversions
Defined completed actions attributed to organic search under selected rules
GA4 or analytics system
Tracking and attribution limitations apply
Marketing contribution
Agreed financial contribution after relevant costs
Finance and sales systems
Depends on margin and cost definitions
Every metric should also document its date range, timezone, currency, exclusions and relevant transformation rules.
When the definition changes, the report should record that change.
Without versioned definitions, historical comparisons can become unreliable.
Why Google Ads, GA4 and CRM Numbers Don’t Always Match
One of the most persistent dashboard problems is disagreement between data sources.
Google Ads reports one conversion total, GA4 reports another, and the CRM records fewer qualified leads.
The instinct is often to search for a connector or reporting tool that can make the totals identical.
But the discrepancy may be legitimate.
According to Google’s documentation on reporting discrepancies, differences can arise from conversion settings, attribution rules, reporting delays and the distinction between clicks and website activity.
For example, Google Ads records advertising clicks, while GA4 records sessions and other user interactions. These are not equivalent units.
The platforms may also attribute conversions using different dates or windows.
What a reliable dashboard should do
First, identify the reporting definition attached to each number.
Second, distinguish platform-attributed conversions from independently recorded business outcomes.
Third, avoid summing revenue figures from several advertising platforms when the same customer purchase may receive credit in more than one system.
For an executive report, use an agreed source of record for total business revenue and qualified outcomes. Show platform-attributed results as supporting diagnostic information.
It’s better to explain why two numbers differ than to conceal the difference through an unexplained calculation.
For teams struggling with GA4’s reporting and retention limitations, our GA4 alternatives guide explores when another analytics platform may help—and when a dashboard built on existing data is sufficient.
How Often Should a Marketing Dashboard Update?
Not every metric needs to refresh in real time.
A daily advertising spend alert serves a different purpose from a quarterly customer lifetime value analysis.
Use reporting frequency that matches the decision.
Reporting Frequency
Appropriate Use
Typical Audience
Daily
Budget problems, broken tracking, active campaign anomalies
Channel specialists
Weekly
Channel trends, campaign adjustments, lead quality
Marketing managers
Monthly
Acquisition efficiency, contribution, budget and business outcomes
Leadership and finance
Quarterly
Strategic investment, market changes and long-term effectiveness
Executive team and board
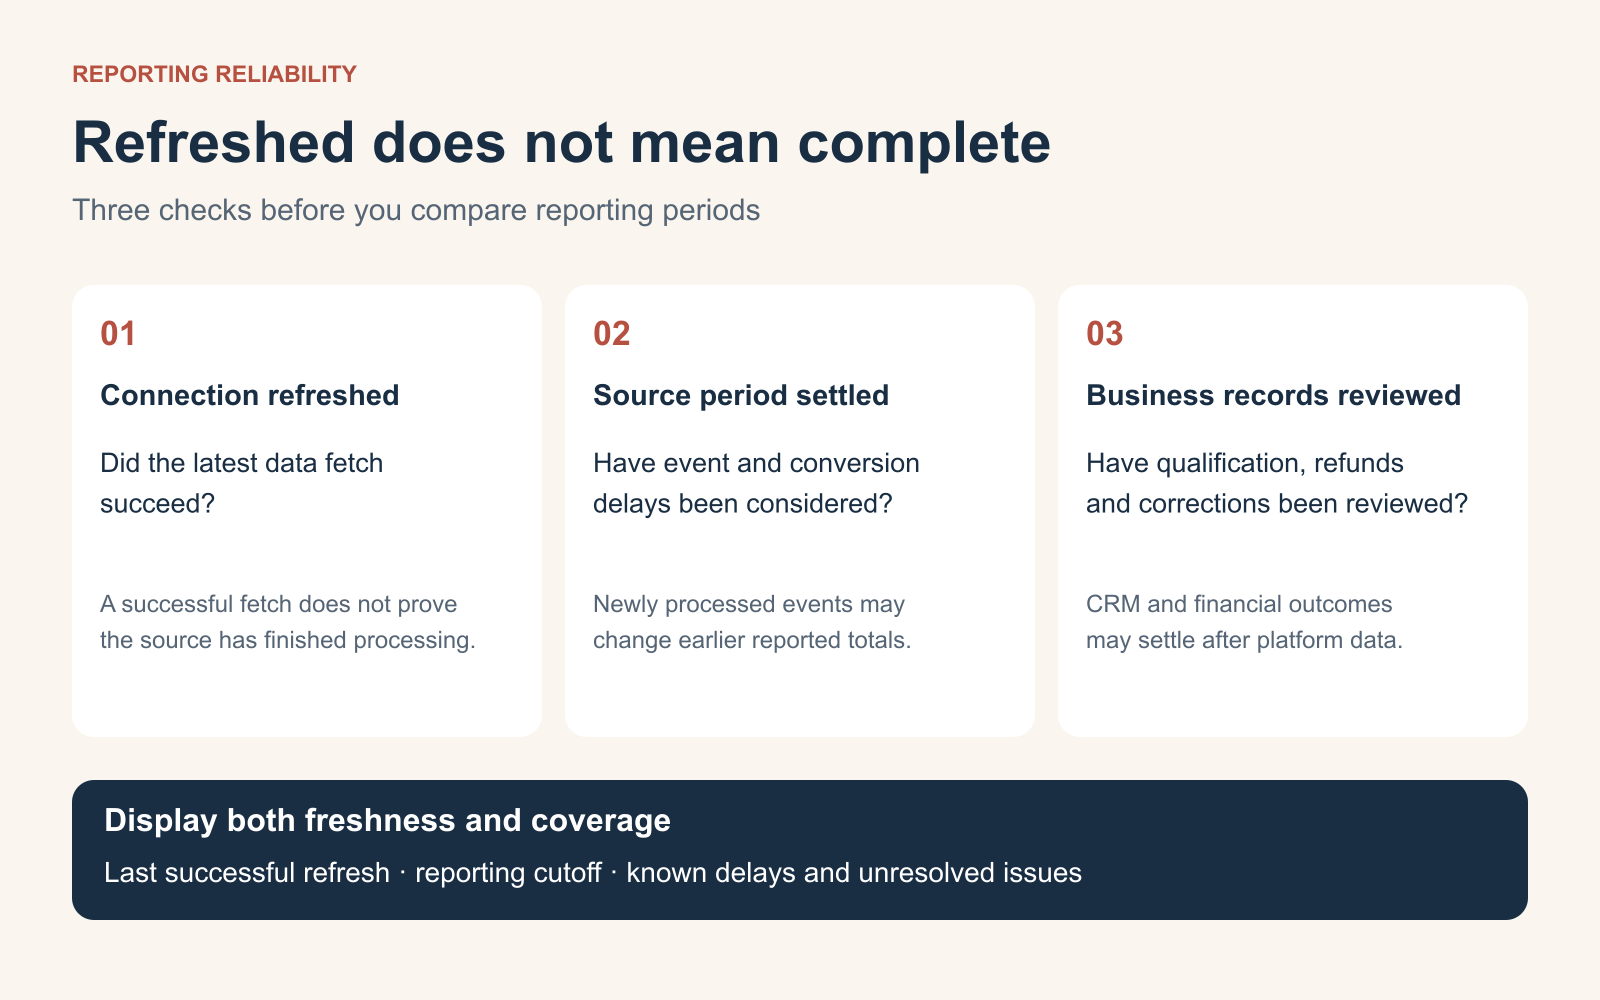
The timing matters because some metrics change after the original reporting date.
Conversions may be reported late, sales opportunities may require manual qualification, and refunds may change previously recorded revenue.
Data freshness is not the same as data completeness
A dashboard displaying a “last refreshed five minutes ago” message may still be showing incomplete data.
The connector may have refreshed successfully while the underlying source has not finished processing events.
Pricing reviewed from official vendor pages in November 2026. Published starting prices use different billing units and do not include all implementation, connector or overage costs. Plans may change.
Google Data Studio: For flexible reports without a large initial software bill
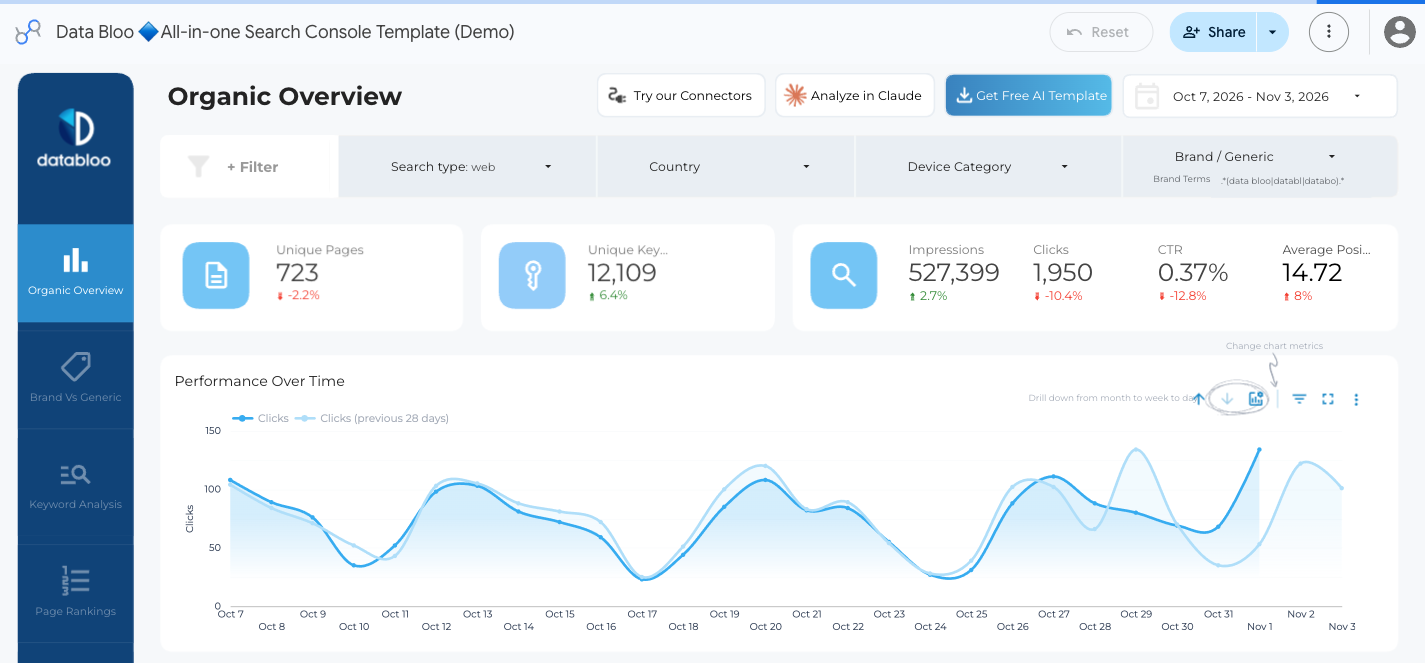
Google’s Data Studio, previously called Looker Studio, allows teams to create custom reports from connected data.
It’s useful for businesses that already work with Google Analytics, Google Ads and other compatible sources.
The free edition can be sufficient when someone on the team can maintain the reports and data definitions.
The main trade-off is the work required to build, validate and update the dashboard.
A free reporting interface doesn’t necessarily mean the entire data pipeline is free, particularly when paid third-party connectors are involved.
Databox: For KPI monitoring and team accountability
Databox offers goals, dashboards, alerts, automated reporting and AI-assisted analysis.
Its free plan includes one user, three data sources and one dashboard.
Paid plans expand reporting and collaboration allowances.
That structure can be useful for teams that want a recurring KPI-review workflow rather than a fully custom business intelligence project.
The main consideration is whether the selected plan includes enough users, data sources and reporting capacity.
AgencyAnalytics: For recurring client reporting
AgencyAnalytics focuses on agency workflows, including client portals, automated reports, templates and account management.
Its official pricing is based on the number of clients managed.
That may be easier to budget for an agency delivering similar reports to several businesses.
However, white-labelling and automation do not guarantee that the reports will contain meaningful insights.
A templated report still requires relevant KPIs, correct definitions and an explanation of performance changes.
DashThis: For straightforward recurring reporting
DashThis is designed for assembling recurring marketing dashboards from connected platforms.
Its entry package includes three dashboards and fifteen data sources when billed annually.
That can be practical for smaller agencies or teams with limited reporting complexity.
The trade-off is that dashboard and source allowances become important as the reporting workload grows.
Power BI: For complex business reporting
Microsoft Power BI offers a more flexible analytical environment for organisations combining marketing with sales, operations and financial data.
It can support sophisticated calculations and larger reporting models.
That depth is useful when the business needs to understand acquisition costs, margins and other outcomes across departments.
But it introduces more responsibility for data modelling and governance.
An enterprise analytics platform may be excessive when the main requirement is a weekly one-page marketing summary.
Supermetrics: For data movement and reporting infrastructure
Supermetrics specialises in connecting marketing data sources to reporting and analysis destinations.
It may be useful when the current problem is collecting reliable information from multiple platforms.
However, moving data into one destination doesn’t automatically reconcile differences in attribution or conversion definitions.
Treat the data pipeline and the dashboard as related but separate parts of the reporting system.
How to Evaluate Marketing Dashboard Software Properly
A vendor demonstration is not enough.
The software may look impressive when populated with perfectly configured sample data.
The useful question is how well it handles your actual reporting process.
We recommend testing shortlisted products against the same reporting brief.
Step 1: Choose five business questions
Write down the questions stakeholders repeatedly ask.
For example:
Are acquisition costs improving?
Which channel produced the most qualified opportunities?
Are we spending within the approved budget?
Which commercial pages are losing organic visibility?
What should the marketing team investigate this week?
These become the benchmark tasks.
Step 2: Use the same available data
Connect the same sources or import a consistent sample dataset.
Confirm that date ranges, currencies, attribution settings and conversion definitions match.
A product should not receive a higher score simply because it displays a larger figure from a different reporting definition.
Step 3: Measure time to first useful action
Start timing from the initial setup.
Stop when the tool helps the evaluator identify a credible issue or action using the relevant data.
This is different from measuring how quickly a template loads.
A dashboard that takes ten minutes to create but cannot explain important changes may be less useful than one requiring more setup and providing a dependable analysis.
Step 4: Evaluate investigation depth
Introduce a known performance change into a test dataset or select a historical period with a documented issue.
Check whether the platform makes the change visible and supports further investigation.
Record how many manual exports, calculations or external steps are required.
Step 5: Check reliability
Disconnect a data source in the test environment or inspect how the system behaves when information is unavailable.
Does the dashboard warn the reader?
Does it continue displaying outdated numbers as though they were current?
Reporting reliability is not just about uptime. It’s about whether users can recognise incomplete or stale information.
Step 6: Calculate total reporting cost
Include subscription charges, connector fees, implementation, analyst maintenance, review meetings and the cost of resolving data problems.
A dashboard may be inexpensive to license but expensive to maintain.
Two Metrics Dashboard Vendors Rarely Lead With
Software comparisons often focus on integrations, visualisations and AI features.
For working marketing teams, two operational measures may be more revealing.
Time to First Useful Action
Measure the elapsed time between starting the reporting workflow and producing the first defensible insight someone can act on.
For example, a team might need to determine why qualified lead costs increased.
A useful reporting system should reduce the work required to identify the affected channel, check supporting evidence and recommend the next investigation.
The metric isn’t simply “time to first dashboard.”
It’s time to first useful decision-support output.
Cost per Resolved Reporting Issue
A reporting platform may identify dozens of anomalies without helping anyone resolve them.
A more useful measure is:
Cost per resolved reporting issue = Total reporting-related cost ÷ Number of documented issues resolved
Suppose a team spends $800 in a month on software and identifiable reporting work.
During that period, it resolves eight reporting or measurement problems.
Its illustrative cost per resolved issue is $100.
That number becomes meaningful only when the issues are defined consistently and their importance is considered.
Fixing a minor chart label isn’t equivalent to correcting duplicated revenue in a board report.
Therefore, use the calculation alongside an assessment of materiality rather than treating all resolved issues as equal.
How to Make Marketing Dashboards More Actionable
Good reporting requires more than choosing the right charts.
The operating process around the dashboard matters just as much.
Assign an owner to each important metric
Someone should be responsible for maintaining the definition and investigating problems.
A marketing manager may own campaign performance, while finance owns the official revenue calculation.
This prevents important discrepancies from remaining unresolved because everyone assumes another team is responsible.
Use alerts for meaningful exceptions
Not every movement needs a notification.
Configure alerts around relevant thresholds, such as significant budget pacing deviations, broken data connections or sustained deterioration in qualified acquisition cost.
Thresholds should reflect the business’s historical variability and commercial risk.
For spending-specific monitoring, our budget pacing tools comparison examines how alerts and forecasting can help teams intervene before month-end problems become more serious.
Write explanations, not just automated summaries
An AI-generated description stating that traffic increased by 15% adds limited value when the chart already shows the change.
A useful summary explains which segments contributed, what evidence supports the interpretation and which questions remain unresolved.
AI systems can assist with investigation, but they should not invent causes or conceal uncertainty.
Review the dashboard in a recurring meeting
A dashboard should be tied to a decision-making process.
For example, a weekly marketing meeting might review the largest exceptions, assign investigations and revisit the previous week’s actions.
Without that discipline, even a sophisticated dashboard may become another destination people rarely open.
Remove metrics that nobody uses
Periodically audit the report.
If a chart hasn’t influenced a question or decision over several reporting cycles, consider moving it to a diagnostic page or removing it.
A concise dashboard is often more useful than a comprehensive one.
The Marketing Dashboard Audit Checklist
Use this checklist before rolling out a new dashboard or refreshing an existing report.
Question
Pass Condition
Is the intended audience clear?
The report has a defined primary reader
Are business outcomes visible first?
The opening section shows the most important KPIs
Are metrics defined consistently?
Sources, formulas and exclusions are documented
Are targets available?
Important metrics can be compared against agreed goals
Can readers identify meaningful changes?
Exceptions are visible without inspecting every chart
Is there a path to investigate problems?
Diagnostic data is accessible
Is data freshness explained?
Users can see update status and reporting cutoffs
Are missing values handled clearly?
Incomplete data is not presented as confirmed zero
Are action owners identified?
Important findings lead to a named next step
Does the report justify its upkeep?
It saves useful time or supports better decisions
A dashboard that fails several of these checks may need better reporting design rather than another software purchase.
Common Marketing Dashboard Mistakes
Showing every available KPI
More metrics create more opportunities for confusion.
Start with the business question and include only the information needed to answer it.
Putting channel metrics ahead of business outcomes
Executives should not need to infer profitability from clicks and impressions.
Show the outcome first and keep campaign diagnostics accessible beneath it.
Treating attributed revenue as total business revenue
Advertising platforms can credit the same purchase under different attribution models.
Don’t add their conversion totals together and present the result as independently recorded sales.
Mixing incomplete and complete reporting periods
Comparing the first five days of a month with the entire previous month can create misleading trends.
Use equivalent periods and flag conversion or sales reporting delays.
Assuming every data source is live
A connected dashboard may still show cached or delayed data.
Display freshness information and establish checks for connection failures.
Using red and green without meaningful thresholds
A metric moving downward is not always bad. A declining acquisition cost may be desirable, while a rising refund rate is not.
Use indicators based on the meaning of the metric and its target.
Relying on AI explanations without verification
An automated summary may describe a correlation as a confirmed cause.
Require supporting evidence and distinguish hypotheses from findings.
Forgetting privacy and access controls
Marketing reports may contain customer information, revenue data and internal performance metrics.
Restrict access appropriately and avoid exposing sensitive records simply because a dashboard can be shared through a public link.
Final Verdict: Build for the Decision, Not the Dashboard
Marketing dashboards have become easier to build, but that hasn’t automatically made them more useful.
Teams can connect advertising platforms, analytics systems and CRMs, create attractive visualisations and schedule reports without solving the underlying reporting problem.
The better approach is to begin with the decisions stakeholders need to make.
Executives need to understand business outcomes.
Marketing managers need to know which channels are changing and why those changes deserve attention.
Specialists need reliable data to investigate problems and recommend action.
When these needs are separated into a clear reporting hierarchy, a dashboard becomes easier to read and easier to maintain.
Software still matters. Reliable integrations, useful alerts, flexible calculations and appropriate access controls can reduce reporting effort.
But those capabilities should support an agreed reporting structure rather than determine it.
A marketing dashboard succeeds when it reduces the distance between seeing a number and making a better decision.
If nobody can explain what they’ll do differently after reading the report, the answer usually isn’t another chart.
It’s a better question.
Frequently Asked Questions
What is a marketing dashboard?
A marketing dashboard is a reporting interface that brings selected marketing data together to help teams monitor performance, identify changes and make decisions. It may combine advertising, analytics, CRM, revenue and other information.
What should be included in a marketing dashboard?
Include the business outcomes relevant to the intended audience, targets, meaningful comparisons, supporting diagnostic information and data definitions. An executive dashboard generally needs fewer metrics than an operational report.
What are the best marketing dashboard tools in 2026?
Looker Studio, Databox, AgencyAnalytics, DashThis, Whatagraph and Power BI serve different reporting needs. The appropriate choice depends on data sources, reporting complexity, collaboration requirements and total cost.
Is Google Data Studio free?
Google provides a no-charge Data Studio reporting option. Its Pro edition is priced separately, and third-party connectors may introduce additional costs.
How many KPIs should a marketing dashboard have?
There’s no universal number. For a concise executive view, four to six carefully selected business measures can be a practical starting point. More detailed channel and diagnostic pages can contain additional metrics where justified.
What’s the difference between a marketing dashboard and a marketing report?
A dashboard provides a recurring or interactive view of selected metrics. A report often adds narrative, interpretation and recommended actions for a particular period. Many reporting platforms support both.
Why do marketing dashboards show different conversion numbers?
Different systems may use different event definitions, attribution models, lookback windows, dates, consent settings and data processing methods. Differences should be investigated and explained rather than hidden.
How often should a marketing dashboard update?
Match the refresh frequency to the decision. Spending and operational alerts may require daily or more frequent information. Leadership reviews may use weekly or monthly summaries, while strategic planning often uses longer periods.
Should executives use the same dashboard as marketing specialists?
They can use the same reporting system, but usually need different levels of detail. Executives need business outcomes and significant changes, while specialists need campaign- and event-level information for diagnosis.
Can AI build a useful marketing dashboard automatically?
AI may help construct reports, summarise trends and identify anomalies. However, the quality of its conclusions still depends on correct metric definitions, reliable data and appropriate human review.
Do I need a paid dashboard tool?
Not necessarily. Existing analytics platforms, spreadsheets and free reporting tools may be sufficient for smaller teams. Paid software becomes more compelling when manual reporting, coordination or data management creates a measurable problem.
How do I know whether a marketing dashboard is successful?
Evaluate whether stakeholders use it to answer recurring questions, identify issues sooner, save reporting effort and document decisions. Dashboard views alone are a weak measure of business value.
About the author
Tom Koh
Tom is the CEO of MediaOne, a leading digital marketing agency. He is a business-experienced SEO consultant as well as a Google Gold Search Expert serving the international community. He has consulted for MNCs like Canon, Maybank, Capitaland, SingTel, ST Engineering, WWF, Cambridge University, as well as Government organisations like Enterprise Singapore, Ministry of Law, National Galleries, NTUC, e2i, SingHealth. His articles are published and referenced in CNA, Straits Times, MoneyFM, Financial Times, Yahoo! Finance, Hubspot, Zendesk, CIO Advisor. Under his stewardship, MediaOne has won dozens of prestigious digital marketing awards.
Your website has 150 published articles. Some attract consistent organic traffic, others haven’t generated a meaningful visit in months, and several cover nearly identical…
Writing a good advertisement sounds simple until you have to create 15 different headlines, stay within character limits, communicate your product’s benefits, and make…
Verifiability matters more than speed when publishing AI-generated content. An AI content generator turns a short brief into draft copy, and its usefulness depends…