Your Meta Ads dashboard reports $80,000 in revenue. Google Ads claims another $65,000. Your ecommerce platform shows $110,000 in total sales.
Which number should you believe?
Potentially all three, within their own definitions. But that doesn’t mean you generated $145,000 in revenue or that every conversion credited to advertising happened because of it.
This is the problem attribution tools are supposed to solve.
Advertisers want to know which campaigns deserve more budget, which channels are taking too much credit, and whether their marketing is generating additional customers rather than simply reaching people who would have purchased anyway.
Privacy changes have made those questions harder to answer. Browsers limit certain tracking methods, mobile operating systems restrict access to identifiers, and consent choices affect the information advertisers can collect.
In response, attribution vendors have developed increasingly sophisticated models that promise to reconstruct customer journeys, estimate missing conversions, and measure advertising effectiveness without relying entirely on individual-level tracking.
Some of these approaches are genuinely useful. Others can create a convincing-looking dashboard without giving marketers enough evidence to make a better decision.
The question isn’t whether an attribution platform uses modelling. It’s whether the model answers the right question, explains its uncertainty, and produces conclusions that remain useful when the data changes.
This guide compares ten attribution and measurement options in 2026, including Google Analytics 4, Triple Whale, Northbeam, Dreamdata, Rockerbox, Fospha, Haus, Measured, Google Meridian, and Meta Robyn.
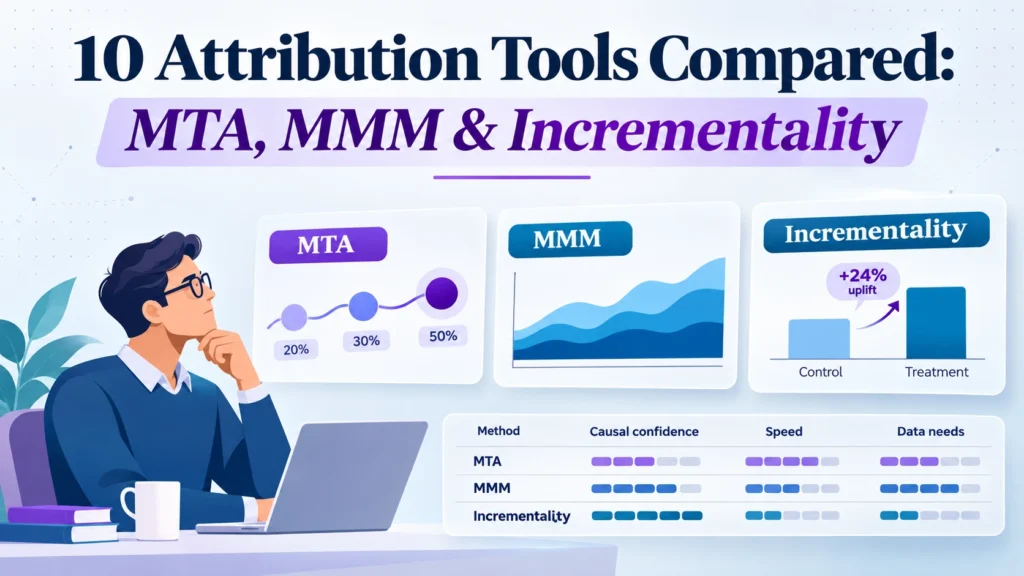
We’ll examine multi-touch attribution (MTA), media mix modelling (MMM), and incrementality testing, along with pricing, data requirements, privacy limitations, and the spending levels at which additional measurement may justify its cost.
Editorial disclosure: This comparison is based on official product documentation, published pricing, and technical resources reviewed in November 2026. DigitalMarketingTools.ai has not independently benchmarked all ten platforms using an identical advertiser dataset. Recommendations reflect documented capabilities and business suitability, not fabricated performance scores or independently verified vendor ROI claims.
Marketing attribution tools help businesses understand how marketing interactions relate to conversions, purchases, and revenue.
They may collect website events, combine information from advertising platforms, reconstruct portions of customer journeys, or use statistical methods to estimate how marketing contributes to business outcomes.
But not every attribution tool measures the same thing.
Some answer: Which tracked interaction should receive credit for this conversion?
Others ask: What proportion of our revenue is associated with spending across different channels?
Incrementality tools address a more demanding question: How much of that revenue would not have happened without the advertising?
These are fundamentally different problems.
MTA vs MMM vs incrementality: The differences at a glance
Measurement Approach
Main Question
Data Typically Required
Main Limitation
Last-click attribution
Which recorded interaction occurred last?
Website events, campaign identifiers
Overcredits the final measurable interaction
Multi-touch attribution (MTA)
How should credit be distributed across observed or reconstructed touchpoints?
Customer journeys, conversions, first-party and platform data
Missing interactions and identity uncertainty
Media mix modelling (MMM)
How has spending across channels contributed to business outcomes over time?
Strong assumptions, data requirements and limited granularity
Incrementality testing
What changed because advertising was delivered or spending changed?
Experimental treatment and comparison groups
Requires valid design, statistical power and operational trade-offs
There isn’t one universally superior approach.
For daily campaign troubleshooting, a well-implemented attribution system may provide information quickly.
For annual budget planning, MMM can help evaluate channel contribution alongside seasonality and other factors.
For deciding whether to cut or increase spending on a major advertising channel, an appropriately designed incrementality experiment may provide stronger causal evidence.
The most mature measurement programmes use these methods together, while recognising that each one has limitations.
Did Third-Party Cookies Actually Disappear?
No. And this distinction matters in 2026.
The advertising industry spent years preparing for Google Chrome to remove third-party cookies.
But Google’s plans changed.
In April 2025, Google announced it would maintain its existing approach to third-party cookie choice in Chrome rather than introduce a new standalone consent prompt.
In October 2025, it also announced plans to retire several Privacy Sandbox technologies, including the Attribution Reporting API, Topics, and Protected Audience.
So describing 2026 as a world where all third-party cookies have disappeared would be inaccurate.
However, advertisers still face real measurement gaps.
Apple’s tracking restrictions, Safari’s protections, consent requirements, fragmented devices, and separate advertising ecosystems all make it difficult to observe every customer interaction.
Apple’s AdAttributionKit, for example, provides privacy-preserving app advertising measurement through postbacks with limited information rather than unrestricted user-level cross-app tracking.
Google Analytics also uses modelling to estimate some events and conversions that cannot be directly observed.
The practical takeaway: Attribution tools don’t operate in a universally cookieless environment. They operate in a fragmented environment where observed data varies by browser, device, consent state, platform, and technical implementation.
Any vendor claiming to reconstruct the complete customer journey should explain precisely what is observed, inferred, and unavailable.
Best Attribution Tools in 2026: Quick Comparison
The following platforms serve different measurement requirements. Some concentrate on customer journeys, others on causal experiments or longer-term statistical modelling.
Prices and capabilities reflect the vendors’ public material reviewed in November 2026. Dollar symbols follow vendor notation. Enterprise features, experimental methods, and contract terms may differ significantly between plans.
The table shouldn’t be read as a ranking of modelling accuracy. Comparing a customer-journey tool against an experimentation platform using one numerical score would imply a like-for-like test that hasn’t been performed.
1. Google Analytics 4 — Start Here Before Buying Attribution Software
Best for: Small and medium-sized businesses that need dependable website conversion reporting and a practical starting point for cross-channel attribution.
Pricing: Standard GA4 is free; Analytics 360 is a paid enterprise offering.
Google Analytics 4 is often sufficient for businesses whose main questions concern traffic sources, website conversions, and campaign performance.
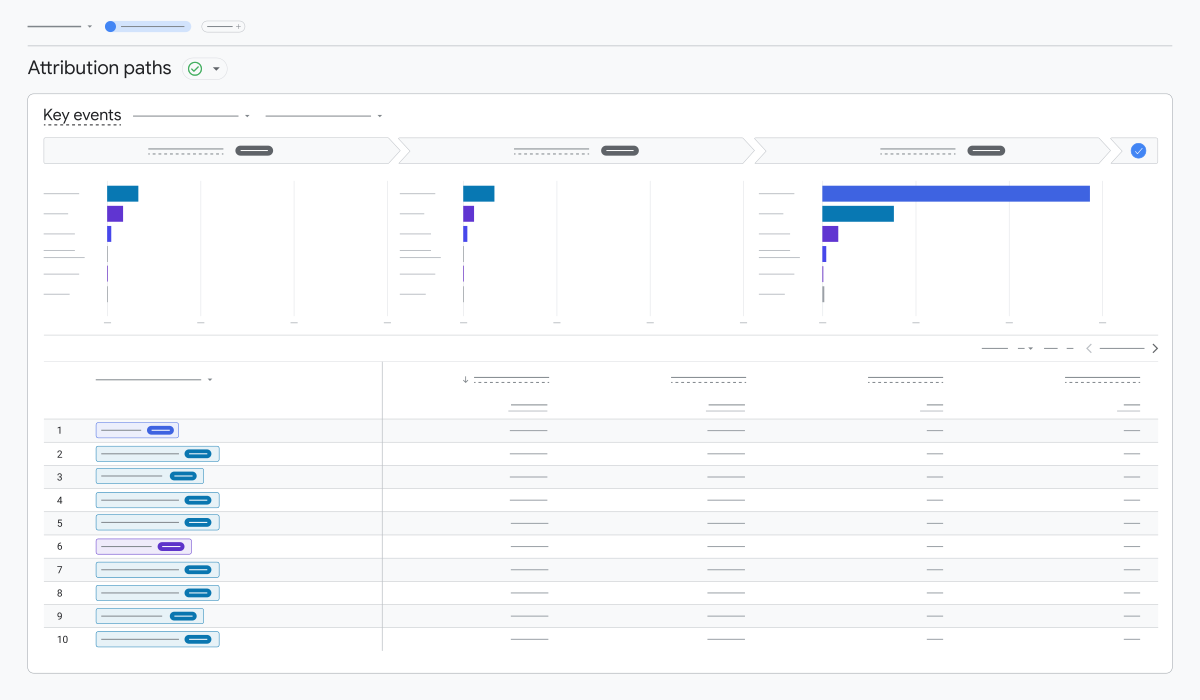
Its attribution reporting includes data-driven attribution and paid-and-organic last-click models.
Google’s official attribution documentation explains that its data-driven approach uses information about converting and non-converting paths to assign credit to eligible interactions.
GA4 can also incorporate modelled key events when some conversions cannot be directly observed.
Where GA4 is useful
GA4 is a reasonable starting point when the team needs to understand which channels are associated with conversions, investigate campaign landing pages, and compare attribution assumptions.
It also integrates with the broader Google advertising ecosystem.
Where it falls short
GA4 isn’t a complete cross-platform incrementality solution.
Its attribution reports depend on available information, configuration, and modelling. A data-driven result shouldn’t automatically be interpreted as proof that a channel caused additional sales.
Businesses may also encounter reporting complexity, data retention limitations, and differences between GA4 and advertising-platform totals.
Our assessment: Fix your conversion implementation and reporting definitions before buying more advanced software. If GA4 is collecting reliable information, a reporting improvement may be more valuable than an immediate platform replacement.
Its Free plan provides basic business reporting and first- and last-click attribution.
The Foundation tier introduces more advanced multi-touch attribution, while Enterprise includes a broader measurement offering involving MMM and incrementality.
That distinction matters.
A buyer signing up for the free dashboard should not assume it includes the same measurement capabilities as the enterprise product.
Where Triple Whale is useful
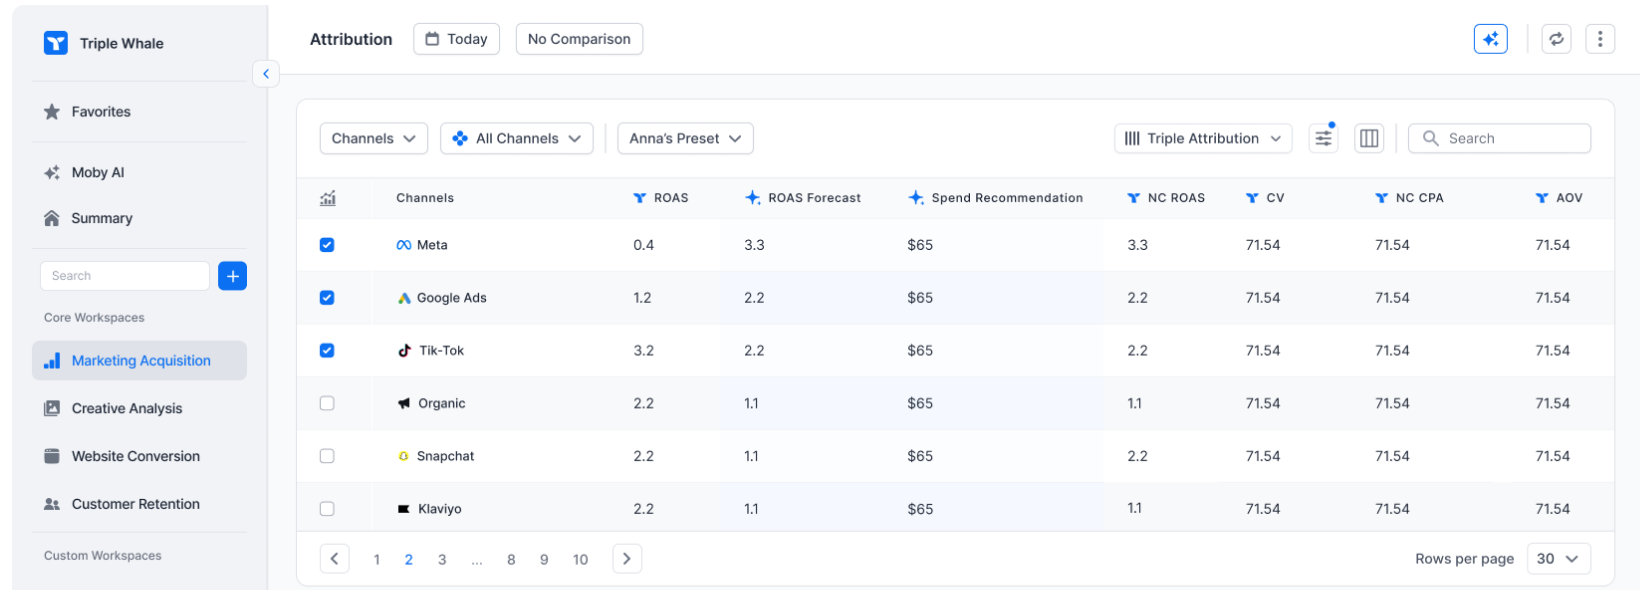
Its ecommerce-focused reporting can help teams connect marketing channels with store performance.
For brands struggling to reconcile multiple advertising dashboards with ecommerce revenue, that consolidated view may be useful.
What to check
Ask how its attribution models handle missing touchpoints, view-through activity, customer identity, and attribution windows.
Also distinguish reporting features from causal experimentation.
A platform offering MTA and incrementality does not mean both are included in every subscription.
Our assessment: Triple Whale is worth considering when ecommerce reporting and advertising optimisation need to work together. Verify the exact measurement capabilities included in your proposed tier.
3. Northbeam — First-Party Multi-Touch Attribution for Ecommerce
Best for: Growing ecommerce advertisers seeking more detailed analysis of campaigns across advertising channels.
Published pricing: Northbeam lists a Professional plan at $3,500/month. Its Starter and other arrangements require confirmation of pricing and usage terms.
Northbeam focuses on first-party attribution, cross-channel reporting, and the interpretation of customer interactions.
It also offers optional incrementality and MMM-related capabilities at certain tiers.
Its primary proposition is providing advertisers with an independent analytical view rather than relying exclusively on conversion totals from each advertising network.
Where Northbeam is useful
Northbeam may suit businesses managing substantial spending across Meta, Google, TikTok, and other channels that want to examine campaign contribution using a consistent reporting framework.
Its published plans also include different levels of strategic support, refresh frequency, and integrations.
What to check
Northbeam explains that its results are expected to differ from advertising-platform reporting.
That difference isn’t automatically a sign that Northbeam is correct and the advertising platforms are wrong.
Ask how the underlying model handles attribution windows, identity matching, incomplete journeys, and view-through conversions.
The vendor also states that pricing can depend on processed pageview volume, so the advertised starting amount may not be the final contracted cost.
Our assessment: A candidate for ecommerce advertisers with enough spending and analytical capacity to make use of granular reporting. The purchasing case should be based on decisions improved, not simply on obtaining a different ROAS number.
4. Dreamdata — Attribution for B2B Revenue and Pipeline
Best for: B2B companies with long sales cycles involving several contacts and interactions.
Pricing: Free plan available; advanced attribution is custom-priced.
Dreamdata addresses a problem that conventional ecommerce attribution systems often handle poorly.
In B2B marketing, the person who clicks an advertisement may not be the person who eventually signs the contract.
A prospect could interact with a webinar, a search advertisement, a product demonstration, and several sales conversations before a deal closes.
Measuring only the final website interaction can overlook much of that process.
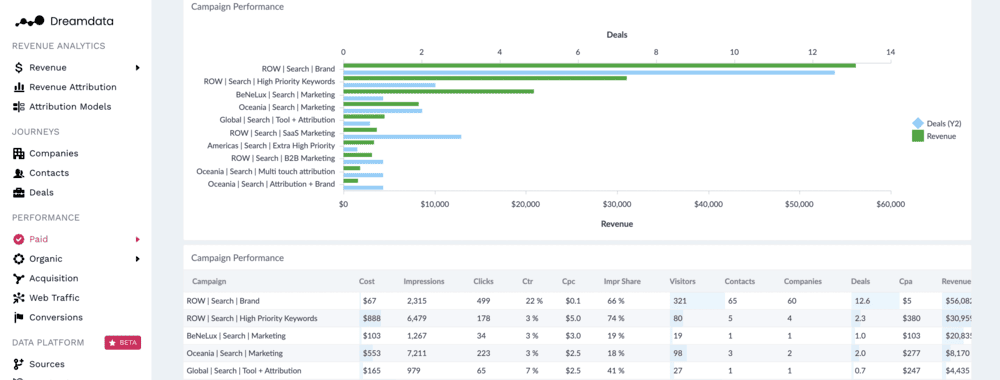
Dreamdata connects marketing interactions with account-level activity, opportunities, and revenue data.
Where Dreamdata is useful
It’s relevant when marketers need to connect campaign activity with CRM stages, qualified pipeline, and closed-won revenue.
Its free tier offers introductory B2B analytics, while more advanced models and activation features belong to paid arrangements.
What to check
B2B attribution depends heavily on CRM hygiene.
If your organisation cannot reliably connect contacts to accounts, track opportunity stages, or maintain consistent revenue records, the software may produce incomplete conclusions.
Our assessment: Dreamdata is more relevant to B2B revenue attribution than a general ecommerce pixel tool. Verify the quality of the CRM data before investing in advanced modelling.
5. Rockerbox — Combining MTA, MMM and Incrementality
Best for: Advertisers that want to consolidate marketing data and use more than one measurement methodology.
Pricing: Custom quotation based on selected products and requirements.
Rockerbox combines data collection and transformation with multi-touch attribution, marketing mix modelling, and incrementality testing.
That combination can help an organisation approach different budget questions using methods suited to each problem.
For example, an attribution model might support recurring campaign reporting, while MMM informs broader allocation and an experiment investigates whether a channel is generating additional revenue.
Where Rockerbox is useful
Rockerbox may suit businesses that have enough marketing activity to benefit from coordinating several measurement approaches.
Its data foundation and export capabilities may also matter to organisations with internal analysts.
What to check
Ask which modules are included in the quotation and how information is reconciled between models.
If MTA, MMM, and experimental results disagree, the platform should help explain why—not simply designate one dashboard as the source of truth.
Our assessment: Worth evaluating for teams pursuing a combined measurement framework. It is probably unnecessary for a business that has not yet established reliable conversion and revenue tracking.
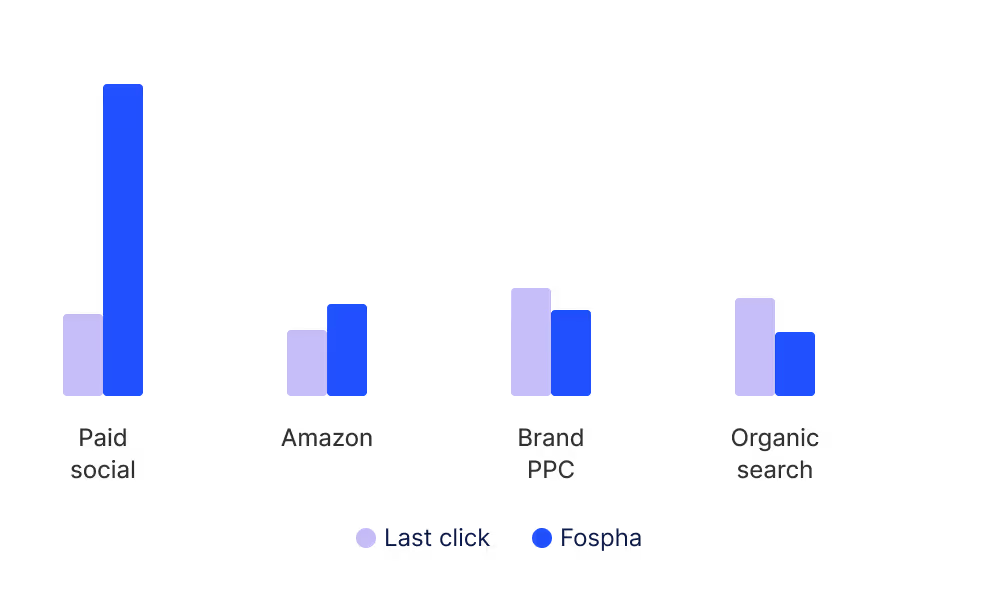
6. Fospha — Media Mix Attribution for Larger Ecommerce Brands
Best for: Ecommerce and retail advertisers with substantial spending across several channels.
Pricing: Custom quotation. Fospha’s current official pricing page positions the product for brands spending more than $150,000 per month on advertising.
Fospha combines media mix attribution with additional MMM, incrementality, and automation options.
Its approach is intended to provide recurring channel-level measurement while also supporting strategic budget planning.
The platform’s public materials describe integrations across advertising networks, ecommerce systems, and other data sources.
Where Fospha is useful
Fospha may appeal to larger teams that need frequent measurement across paid social, search, marketplaces, and other channels.
Its broader measurement offering can be useful when the business needs both operational reporting and longer-term allocation decisions.
What to check
The current pricing page structures its offering as a combination of measurement suites rather than one universal monthly subscription.
Confirm which modelling and testing capabilities are included, whether implementation requires historical data preparation, and what ongoing support costs.
Be cautious about vendor-reported revenue improvements. They describe selected customer outcomes, not a reliable prediction of what your business will achieve.
Our assessment: Most relevant when advertising spending, data volume, and channel complexity justify a substantial measurement investment.
7. Haus — Incrementality Experiments and Causal MMM
Best for: Advertisers trying to determine whether media spending causes additional business outcomes.
Pricing: Custom quotation.
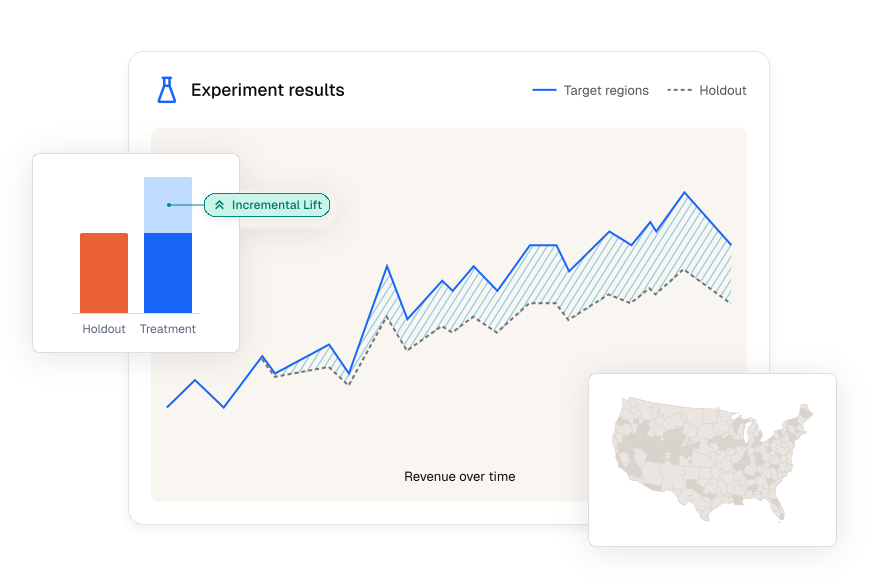
Haus specialises in incrementality measurement, including geographic tests and other experimental approaches.
Its platform helps advertisers compare performance under different advertising conditions rather than relying exclusively on observed customer journeys.
For example, a company may reduce advertising in selected regions while maintaining its previous strategy in comparable regions.
If the experiment is properly designed, the resulting differences can help estimate the additional sales caused by the advertising activity.
Where Haus is useful
Haus is particularly relevant when a business is considering a meaningful budget change.
It can support questions such as whether an advertising channel deserves more spending, whether a campaign adds sales beyond existing demand, or whether a particular marketing activity is less effective than platform reporting suggests.
What to check
Experiments require sufficient data, appropriate control groups, and careful handling of spillover effects.
A small business with limited geographical reach may struggle to design a test with enough statistical power.
Also ask how the platform reports confidence intervals, uncertainty, and inconclusive outcomes.
Our assessment: A relevant option when the cost of getting a major budget decision wrong is substantial enough to justify experimental measurement.
8. Measured — Incrementality Testing for Omnichannel Advertisers
Best for: Larger marketing teams coordinating digital advertising, marketplaces, retail, and other sales channels.
Pricing: Custom quotation.
Measured combines incrementality testing, MMM, and cross-channel reporting.
Its experimentation platform supports different testing structures, including geographic and first-party audience-based designs.
In April 2026, Measured announced an updated geographic testing experience intended to simplify experiments across several channels and business outcomes.
Where Measured is useful
Measured is worth considering for organisations that need a systematic experimentation programme rather than a one-off campaign test.
For example, a retailer selling both online and through physical stores may want to understand whether digital advertising increases total sales rather than just ecommerce orders.
What to check
Ask which experiments can be run with your available markets and data.
Also investigate how tests influence the MMM, how uncertainty is communicated, and whether the platform provides actionable recommendations when a result is inconclusive.
Our assessment: A serious candidate for companies that can implement repeated experiments and translate the results into budget decisions. Its value depends on operational follow-through as much as statistical sophistication.
9. Google Meridian — Open-Source Media Mix Modelling
Best for: Organisations with capable analytics teams and enough historical marketing data to build and maintain their own models.
Software cost: Free and open source; infrastructure, technical labour, and data preparation are separate costs.
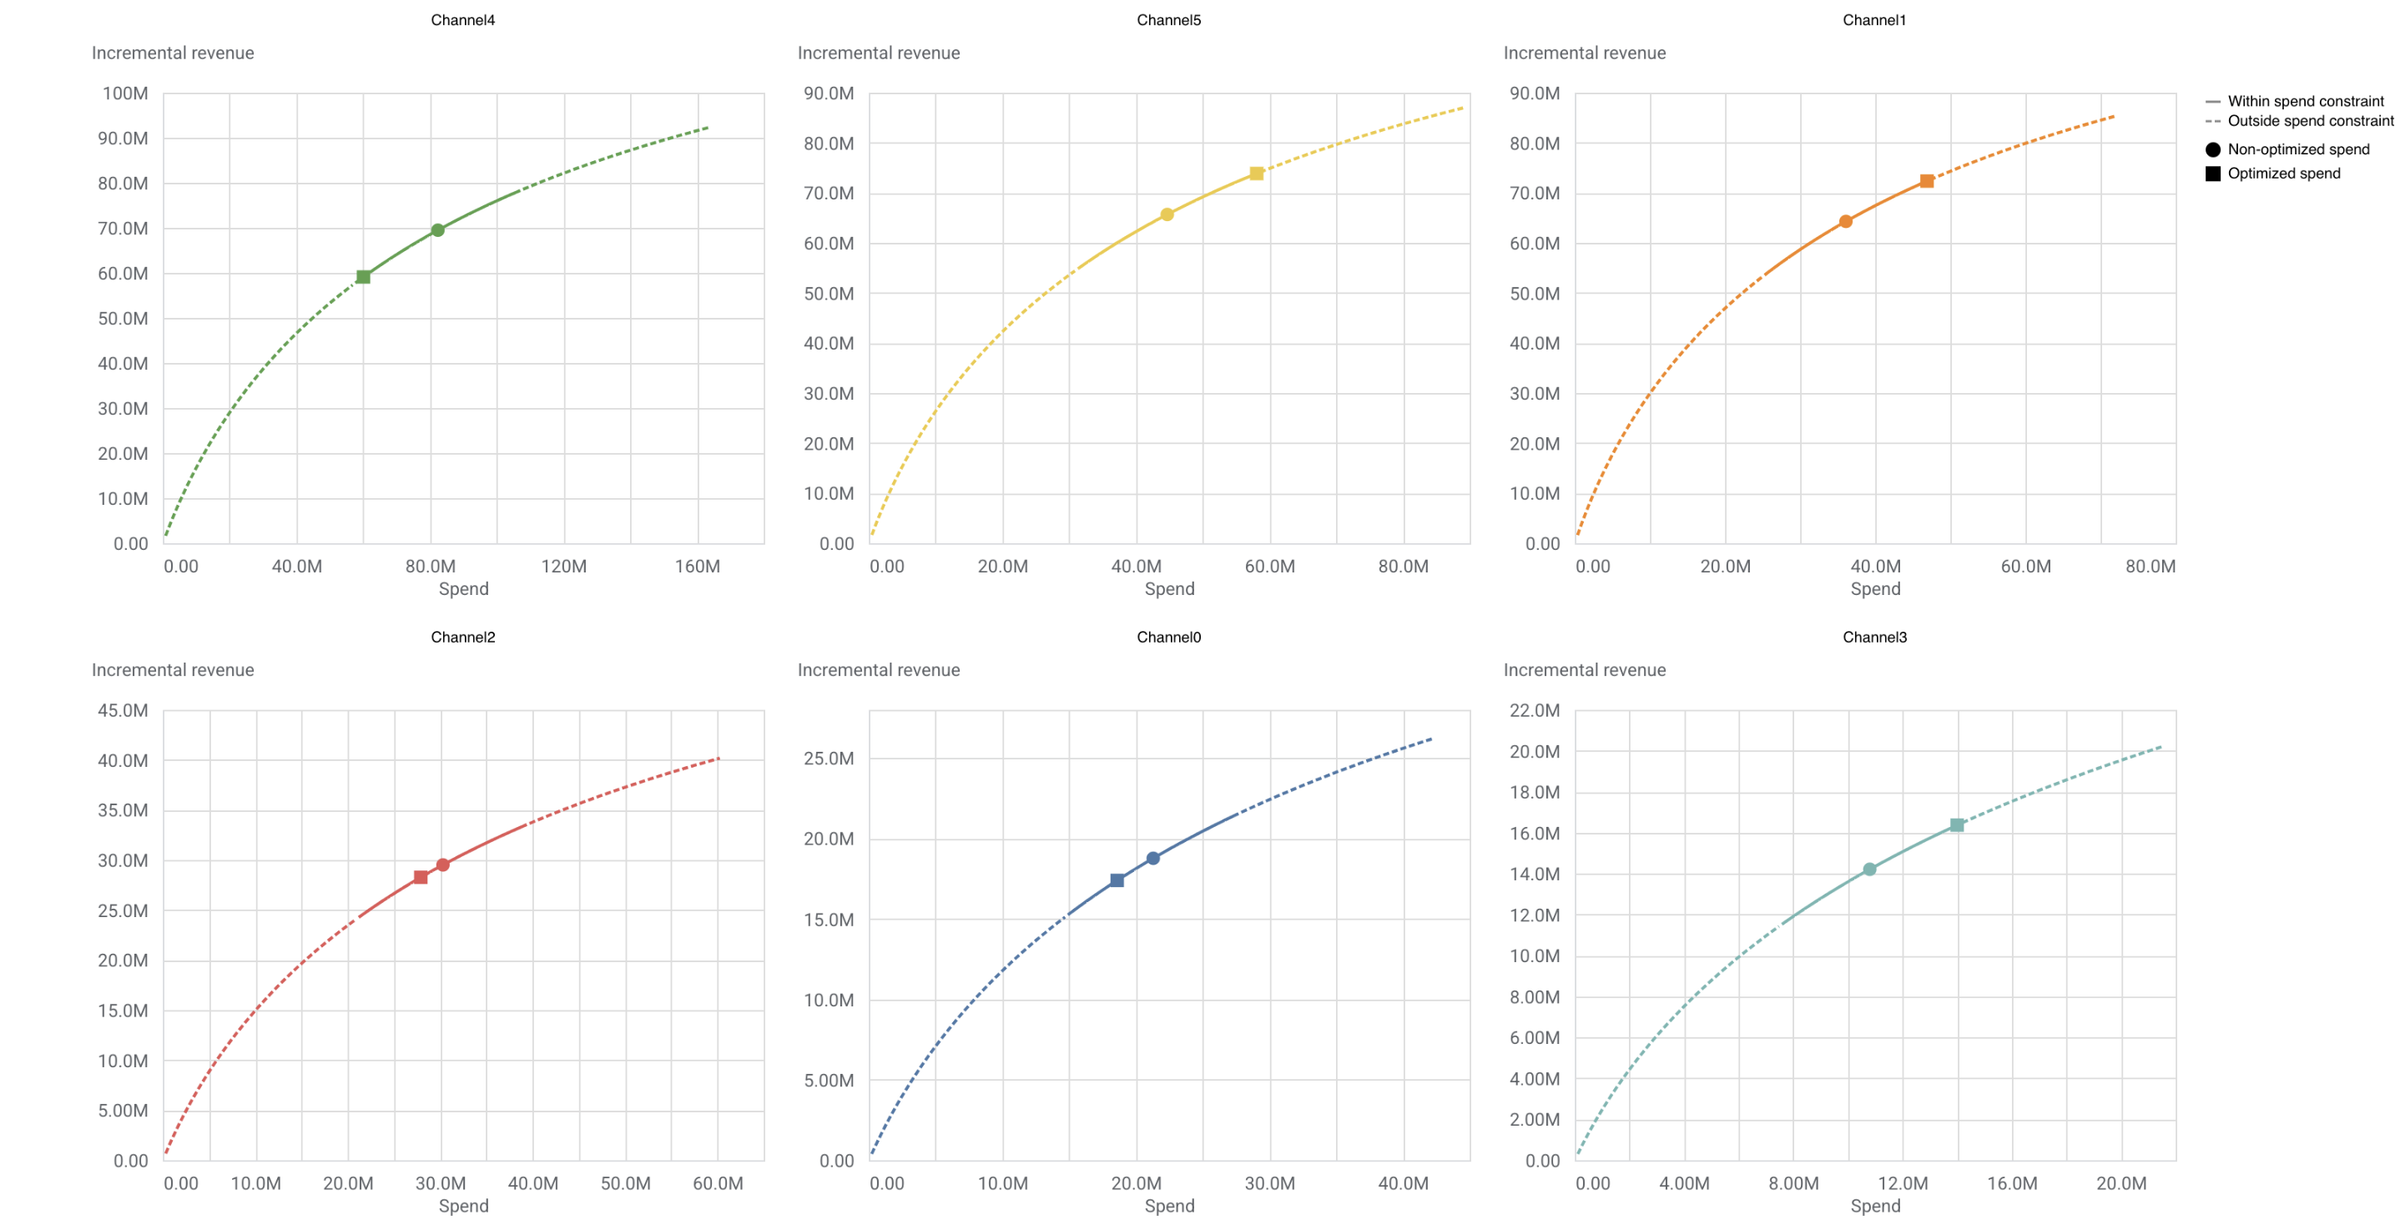
Google Meridian is an open-source MMM framework based on Bayesian statistical modelling.
It uses aggregated information about media activity, business outcomes, and other relevant factors to estimate channel contribution.
Its documentation supports incorporating experiment results and using model outputs for planning and budget allocation.
Where Meridian is useful
Meridian can be valuable when an organisation wants greater visibility into modelling assumptions and the ability to customise its implementation.
It can also reduce dependency on proprietary measurement software.
However, access to the source code doesn’t automatically make it easy to operate.
The data requirement buyers overlook
Google generally recommends at least two years of weekly historical data for geo-level models and three years for national-level models.
Even that may be insufficient if the dataset contains too many variables, too little spending variation, or poorly recorded business outcomes.
A model with insufficient information can generate plausible results that are too uncertain to support budget decisions.
Our assessment: Meridian is attractive for technically capable teams that want transparent, customisable MMM. It’s not a ready-made replacement for basic campaign reporting.
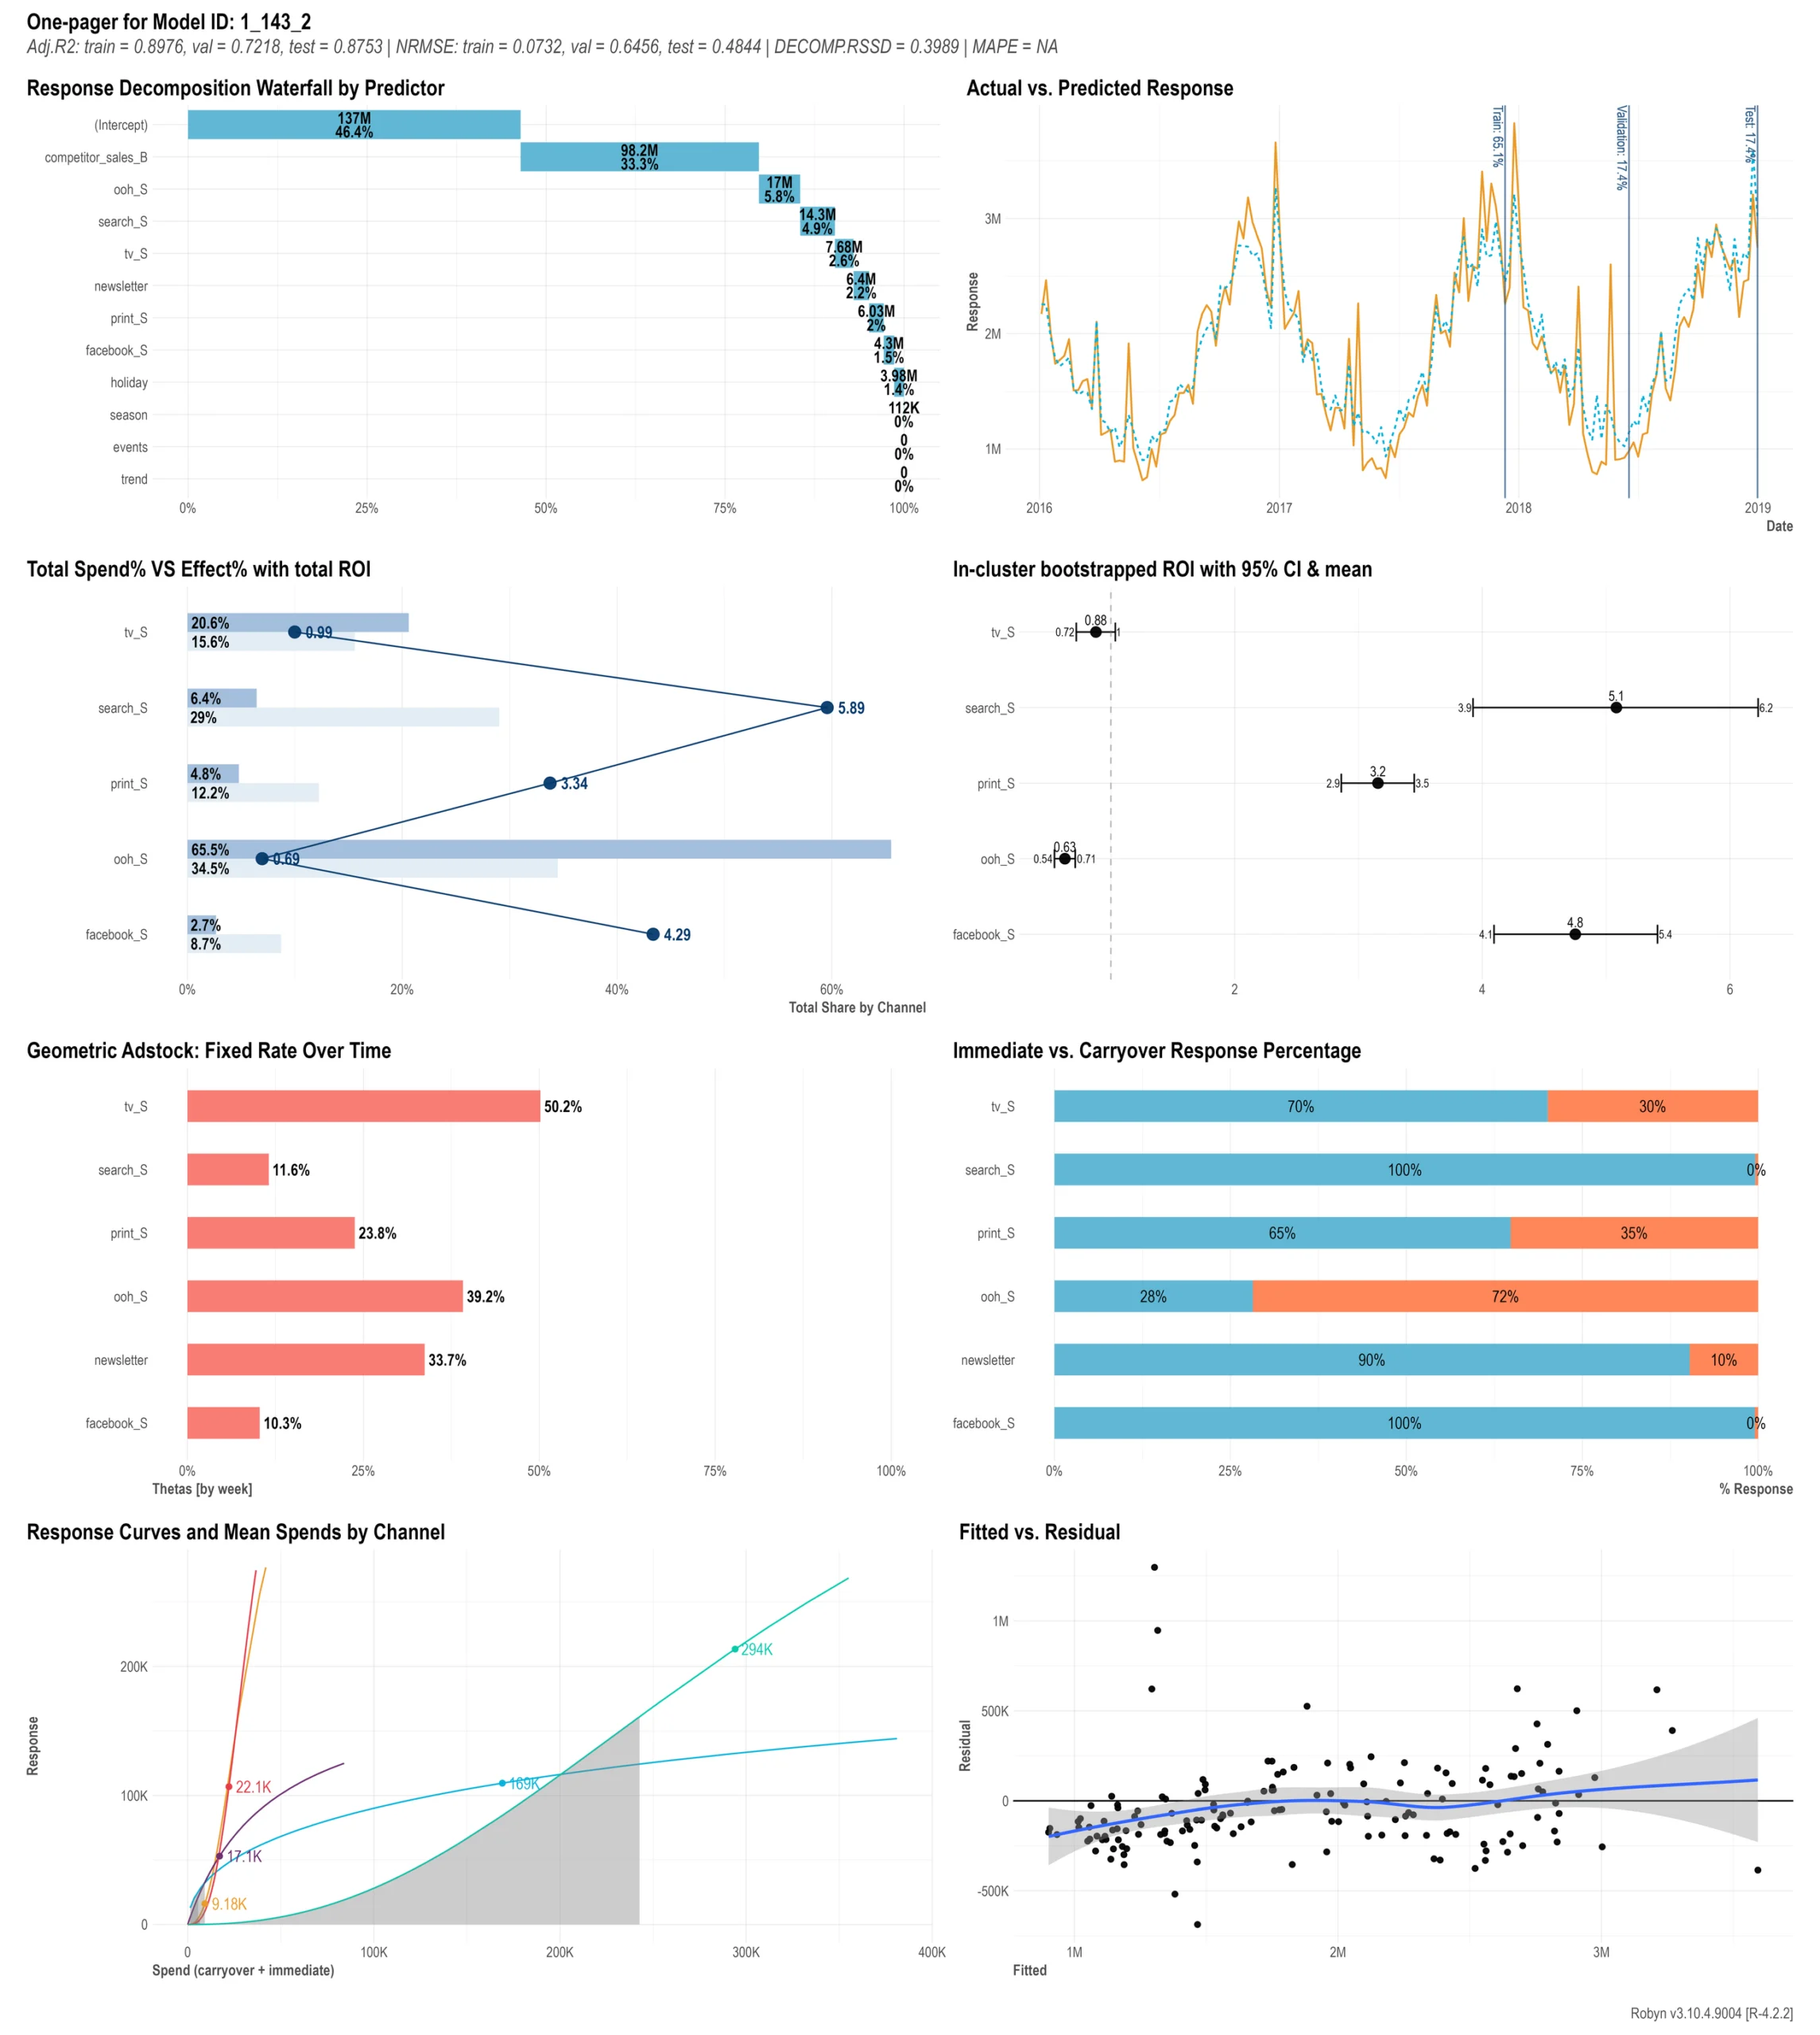
10. Meta Robyn — Open-Source MMM and Budget Allocation
Best for: Marketing science teams that want a customisable modelling framework and can maintain their own analytical workflow.
Software cost: Free and open source; implementation and maintenance costs additional.
Meta Robyn is an open-source MMM framework that uses statistical modelling and automated parameter optimisation.
It also supports model calibration using external evidence and provides budget-allocation functionality.
One of its advantages is that it does not require individual-level customer histories or third-party cookie data.
Where Robyn is useful
Robyn can help analysts investigate how media spending relates to business outcomes while accounting for factors such as seasonality.
It may also be useful for teams building their own reproducible marketing measurement process.
What to check
Meta’s documentation recommends substantial historical data, generally at least two years of weekly observations.
The tool also requires analysts to make decisions about input quality, modelling variables, validation and interpretation.
Open-source availability removes the software licence fee, not the cost of competent analysis.
Our assessment: Robyn is worth evaluating when your team has the statistical expertise to build, challenge, and maintain an MMM. It’s not a plug-and-play attribution dashboard.
How Much Should You Spend Before Investing in Advanced Attribution?
This is the financial question many measurement vendors avoid answering directly.
There is no universal advertising-spend threshold at which a business suddenly needs MMM or incrementality testing.
The decision depends on how much money is at risk, whether the business can use the findings, and how confidently it can measure outcomes.
Still, some spending ranges can help frame the discussion.
Illustrative Monthly Media Spend
Practical Starting Approach
What May Justify More
Under $25,000
Native ad reporting, GA4, revenue and CRM checks
Persistent conversion gaps or high-value long sales cycles
Multiple channels and meaningful budget-allocation uncertainty
$150,000–$500,000
Evaluate specialist MTA, targeted experiments, or MMM readiness
Sufficient data and material decisions between channels
Above $500,000
Consider a coordinated measurement programme using multiple methods
Significant financial exposure, several markets, and organisational capacity
These are editorial planning ranges, not industry-standard requirements or evidence that any particular tool will deliver positive ROI at these spending levels. The actual threshold can be much higher or lower.
A company spending $15,000 monthly with a long B2B sales cycle may need better CRM attribution more urgently than an ecommerce brand spending $100,000 on one well-understood channel.
Likewise, a brand spending $500,000 monthly may still lack the historical variation needed for a reliable MMM.
Spending determines the potential financial value of a better decision. Data quality determines whether the tool can help make that decision.
The Real Break-Even Calculation for Attribution Software
Suppose a company spends $80,000 monthly across several advertising channels.
It’s considering an attribution tool costing $1,500 per month.
That software represents 1.875% of its media spending.
But the tool isn’t worthwhile simply because the subscription looks small compared with the advertising budget.
It must generate at least $1,500 in monthly value through improved contribution margin, demonstrable savings, better operational efficiency, or avoided mistakes.
For example, the platform might identify an inefficient campaign and help the team reallocate spending.
That could create value—but a model’s recommendation isn’t proof of the resulting improvement.
Where possible, validate the effect through a controlled test or a clearly documented decision and outcome.
A useful financial framework is:
Net measurement value = Verified incremental contribution + operational savings + avoidable costs prevented − total measurement costs
Measurement costs should include the subscription, implementation, analyst time, data infrastructure, and any experiment-related spending sacrifices.
If an experiment involves withholding advertising from potential customers, that opportunity cost also belongs in the decision.
Don’t assume more sophisticated measurement is always worth purchasing.
Sometimes fixing conversion tracking or improving the quality of CRM data produces a better return.
Multi-Touch Attribution vs MMM: Which Should You Choose?
These methods are often marketed as competitors, but they’re better understood as tools for different levels of decision-making.
Choose MTA when you need operational detail
Multi-touch attribution is useful when advertisers want to investigate customer journeys and compare activity across campaigns.
It’s particularly relevant when the team needs recurring performance information at relatively granular levels.
However, it depends on observed and reconstructed interactions.
If customers switch devices, decline tracking, or interact with media that isn’t represented in the dataset, important information may be missing.
A vendor may use modelling to account for those gaps.
That doesn’t make the approach invalid, but the modelling assumptions should be documented.
Choose MMM when you need broader allocation decisions
MMM is more appropriate for questions involving total spending across channels, seasonality, promotions, and other factors affecting business outcomes.
It can include channels for which individual customer journeys aren’t observable.
However, MMM results depend on historical data, assumptions, and the amount of variation available to distinguish channel effects.
If two channels always increase spending together, separating their individual contributions may be difficult.
Choose incrementality testing when causality matters
An experiment helps answer what changed because advertising activity changed.
It is particularly valuable when a business is considering cutting, increasing, or introducing significant spending.
A well-designed experiment provides more direct evidence of causality than simply assigning credit to customer interactions.
However, experiments can be expensive, operationally disruptive, and inconclusive when the available sample is too small.
Use several methods when the decision requires it
A mature programme may use MTA for operational reporting, MMM for strategic planning, and experiments to challenge or calibrate assumptions.
That approach is often described as triangulated measurement.
The objective isn’t to make every model produce the same answer. It’s to understand why they differ and which evidence is appropriate for the decision being made.
How Incrementality Testing Works: A Simple Example
Imagine an advertiser wants to know whether a paid social campaign creates additional purchases.
It randomly divides eligible customers into two comparable groups.
One group receives the advertising treatment. The other is withheld from that treatment.
Suppose the results are:
Metric
Treatment Group
Control Group
Eligible customers
10,000
10,000
Purchases
440
400
Purchase rate
4.4%
4.0%
The treatment group’s purchase rate is 0.4 percentage points higher.
Under a valid experimental design, that difference corresponds to an estimated 40 additional purchases among 10,000 eligible customers.
However, the numerical difference alone doesn’t establish statistical significance.
A proper analysis would consider uncertainty, random variation, potential contamination between groups, and whether the test was sufficiently powered.
If advertising costs and the value of additional purchases are available, the experiment may also support an estimate of incremental return on ad spend.
This example is illustrative and is not a completed DMT experiment.
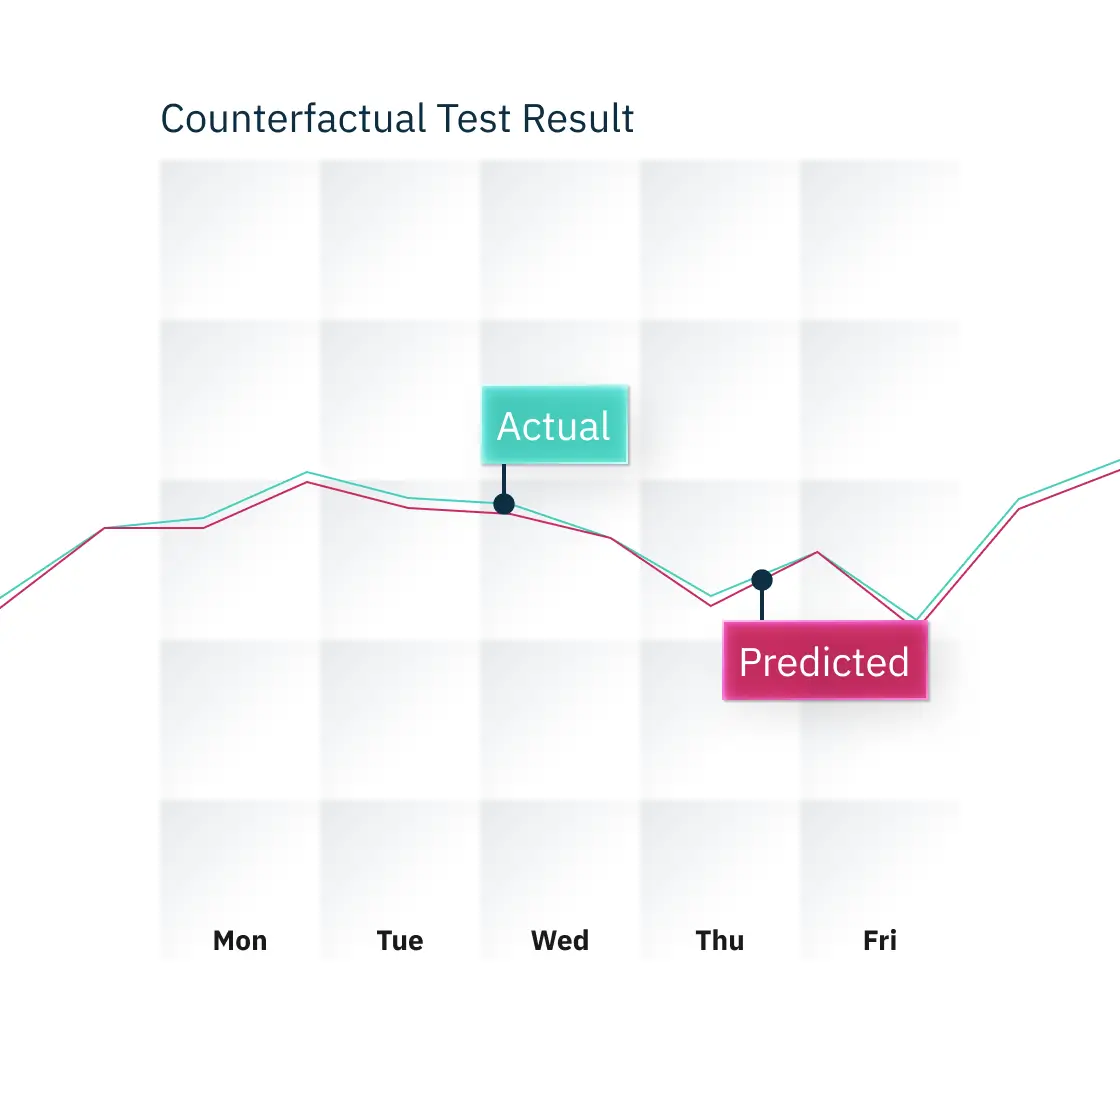
The main lesson is that incrementality measures the difference advertising makes relative to a counterfactual—not merely how many conversions the platform claims.
How to Evaluate an Attribution Tool Properly
Before purchasing a new attribution product, choose a business question the tool must answer.
For example:
Should we reduce branded search spending and reallocate some of the budget to prospecting?
Then test whether the platform provides enough trustworthy evidence to inform that decision.
Step 1: Audit your current measurement
Start with transaction totals, conversion tracking, campaign identifiers, consent handling, and CRM data where relevant.
Check whether your recorded outcomes reconcile with the business’s actual sales or revenue records.
A measurement platform cannot reliably solve problems caused by duplicated transactions or incorrect conversion definitions.
Step 2: Establish a baseline
Choose a comparison period and record current campaign reporting.
Document the attribution windows, time zones, currencies, customer definitions, and included channels.
If two systems measure different events, their reported revenue totals shouldn’t be expected to match.
Step 3: Separate observed data from modelled data
Ask the vendor to explain which information comes from actual recorded interactions and which is estimated.
Important questions include whether the model uses device graphs, server-side events, aggregate statistics, or other sources.
Also ask which data is excluded.
A good explanation should make the limitations understandable to a marketing manager, not only a statistician.
Step 4: Examine model stability
Run the same reporting question across several comparable periods.
If a channel’s apparent contribution changes dramatically without a meaningful change in spending, conversions, or market conditions, investigate why.
Changes may be legitimate, but the vendor should help explain the cause.
For MMM, examine uncertainty intervals, holdout predictions, and the sensitivity of results to modelling assumptions.
Step 5: Test a real decision
Identify a budget decision you would make differently because of the new platform.
If the tool recommends reducing spending on a channel, ask what evidence supports that recommendation and how it could be validated.
Avoid changing several major campaign variables at the same time if you want to understand the effect of one change.
Step 6: Record the total cost
Include subscription fees, integrations, data engineering, analyst time, training, and the cost of recurring model maintenance.
A tool that produces a sophisticated report but requires extensive manual reconciliation each month may be less valuable than it first appears.
Attribution Tool Evaluation Scorecard
Use a consistent framework when comparing products.
Criterion
Suggested Weight
What to Evaluate
Decision relevance
25%
Does the tool answer a meaningful business question?
Data transparency
20%
Can observed and modelled information be distinguished?
Model validation
20%
Are assumptions, uncertainty and validation results available?
Integration quality
15%
Can the platform use reliable sales, CRM and advertising data?
Time to useful insight
10%
How long before the team can act on a credible finding?
Total cost
10%
Subscription, infrastructure, implementation and ongoing labour
Score each criterion from 1 to 5 after a practical evaluation.
If something cannot be independently assessed, label it not evaluated instead of inventing a score.
These weights are suggested buyer criteria rather than results from a completed comparative benchmark.
The Privacy Questions Every Attribution Vendor Should Answer
First-party data is valuable, but it isn’t a blanket exemption from privacy obligations.
A tool describing itself as cookieless or privacy-safe should still explain what information it collects, how it is processed, and which rules apply.
Before connecting a platform, ask:
Does the system collect personal or pseudonymous identifiers?
Which activities rely on cookies, server-side tracking, or consented integrations?
How are consent choices respected across connected platforms?
Where is customer data stored, and for how long?
Can customer-level data be exported or deleted?
Which subprocessors have access to the information?
Does the vendor use your data to improve models shared across customers?
Google’s Consent Mode documentation explains how its tags adapt to consent signals and support different levels of conversion modelling.
However, Consent Mode isn’t a consent banner or a replacement for complying with applicable privacy requirements.
Similarly, server-side tracking doesn’t automatically make collection lawful or restore information that users have chosen not to share.
Privacy durability means having a measurement approach that remains useful under realistic data constraints—not finding a technical way to ignore those constraints.
Common Attribution Mistakes to Avoid
Treating Platform-Reported ROAS as Incremental ROAS
A platform can attribute a purchase to an advertisement without proving that the purchase would not have occurred otherwise.
Use attribution for the questions it can answer and experiments when the decision requires causal evidence.
Assuming First-Party Tracking Solves Every Gap
First-party data can improve measurement, but it doesn’t necessarily capture every cross-device, offline, or unconsented interaction.
Vendors should explain the limits of the information available.
Building MMM Without Enough Data
A sophisticated model trained on insufficient or highly correlated data may produce unstable estimates.
Check historical data requirements before selecting a framework.
Comparing Different Attribution Windows
Two systems may report different totals because one includes view-through conversions or uses a longer lookback window.
Align definitions before interpreting the gap.
Choosing a Tool Because Its Revenue Number Is Higher
A higher reported revenue total isn’t necessarily more accurate.
Ask how the estimate was calculated and whether the assumptions are reasonable.
Buying Enterprise Software Before Fixing CRM Data
For B2B companies, incomplete account matching and opportunity records can undermine attribution quality.
Improve the data foundation first.
Optimising Every Channel Using One Model
Different models have different strengths.
Use the measurement approach appropriate to the decision rather than insisting that one attribution score governs everything.
Our advertising performance metrics guide explains why ROAS, CPA, and customer acquisition cost also need to be interpreted alongside margins and business outcomes.
When You Don’t Need Another Attribution Tool
Not every advertiser needs paid attribution software.
A small business managing one Google Ads account may get enough information from accurate conversion tracking, GA4, and its sales records.
A company whose primary problem is overspending may benefit more from better budget controls than from MMM.
Similarly, a business struggling to generate qualified leads may need to improve its offer, landing pages, or targeting before investing in a new measurement platform.
Our budget pacing tools comparison covers a different but related operational problem: ensuring campaign spending follows an approved plan.
The point is to identify the decision that is currently difficult to make.
If the existing information is sufficient, buying another dashboard won’t necessarily improve the outcome.
Final Verdict: Don’t Buy Attribution Software Until You Know What Decision It Must Support
Attribution software has become more sophisticated as advertising measurement has become more fragmented.
But sophistication doesn’t automatically produce better decisions.
If you primarily need to understand website conversions, GA4 and reliable first-party measurement may be sufficient.
If you’re an ecommerce brand managing substantial spending across several channels, a platform such as Triple Whale, Northbeam, or Fospha may provide more useful analysis.
If you’re a B2B company with complex customer journeys, account-level attribution may be more relevant.
And if you’re making significant channel-allocation decisions, incrementality testing or MMM may be worth the additional effort.
The most important distinction is between assigning credit and establishing causality.
A marketing dashboard can tell you where revenue was attributed. It cannot always tell you which revenue would have disappeared without the advertising.
That’s why measurement should be selected around the financial decision, not the technology category.
Before purchasing, ask what data the platform requires, what assumptions it makes, what remains unobserved, and how its recommendations can be challenged.
The best attribution tool isn’t the one that claims the most revenue. It’s the one that helps your team make a better budget decision—and makes the uncertainty behind that decision visible.
Frequently Asked Questions
What is the best marketing attribution tool in 2026?
There isn’t one best option for every business. GA4 is a reasonable starting point for website and campaign attribution. Ecommerce brands may evaluate Triple Whale or Northbeam, while B2B businesses may prefer Dreamdata. Larger organisations may benefit from MMM and incrementality platforms.
Is multi-touch attribution still useful without third-party cookies?
Yes, but its coverage depends on the available information. First-party events, consented identifiers, integrations, and statistical modelling can support attribution, although missing customer interactions remain a limitation.
Is marketing mix modelling better than multi-touch attribution?
MMM is often more suitable for strategic channel allocation and evaluating aggregate trends. MTA is generally more useful for recurring journey and campaign reporting. Neither is universally better because the methods answer different questions.
What is the difference between attribution and incrementality?
Attribution distributes credit for conversions across marketing interactions. Incrementality estimates how many additional conversions or sales occurred because of an activity, usually through a comparison with a control or counterfactual.
How much advertising spend do you need for MMM?
There’s no universal minimum. Data history, spending variation, channel complexity, and analytical capability matter. Google Meridian generally recommends at least two years of weekly data for geo-level models and longer histories for national models.
Are open-source MMM tools free?
Google Meridian and Meta Robyn are available as open-source software. However, data preparation, infrastructure, technical expertise, model validation, and ongoing maintenance still create costs.
Can attribution tools measure offline sales?
Some can incorporate offline conversions, CRM data, or aggregated sales information. The quality of the analysis depends on the available data and the modelling approach. Not every product supports offline outcomes equally.
Why do Meta, Google Ads and GA4 report different revenue?
They may use different attribution windows, conversion definitions, view-through rules, identity information, data sources, and modelling methods. Different totals don’t automatically mean one platform is malfunctioning.
Does server-side tracking eliminate the need for consent?
No. Server-side processing doesn’t remove legal obligations concerning personal data or tracking. Review the actual data collected and applicable privacy requirements.
How long does incrementality testing take?
It depends on conversion volume, experimental design, expected effect size, and the required confidence. Some tests may be practical within weeks, while others need longer periods or may be statistically inconclusive.
Which attribution tool is best for B2B SaaS?
Dreamdata is worth considering because it focuses on account-level customer journeys, CRM integration, pipeline, and revenue. However, a business with unreliable CRM data should address that problem before expecting advanced attribution to help.
How often should an attribution model be reviewed?
Review major changes after tracking updates, shifts in channel mix, consent or platform changes, and material changes in business performance. MMM should also be evaluated against new data and experimental evidence when available.
About the author
Tom Koh
Tom is the CEO of MediaOne, a leading digital marketing agency. He is a business-experienced SEO consultant as well as a Google Gold Search Expert serving the international community. He has consulted for MNCs like Canon, Maybank, Capitaland, SingTel, ST Engineering, WWF, Cambridge University, as well as Government organisations like Enterprise Singapore, Ministry of Law, National Galleries, NTUC, e2i, SingHealth. His articles are published and referenced in CNA, Straits Times, MoneyFM, Financial Times, Yahoo! Finance, Hubspot, Zendesk, CIO Advisor. Under his stewardship, MediaOne has won dozens of prestigious digital marketing awards.
Your website has 150 published articles. Some attract consistent organic traffic, others haven’t generated a meaningful visit in months, and several cover nearly identical…
Writing a good advertisement sounds simple until you have to create 15 different headlines, stay within character limits, communicate your product’s benefits, and make…
Verifiability matters more than speed when publishing AI-generated content. An AI content generator turns a short brief into draft copy, and its usefulness depends…