An image compressor claims it can reduce your website images by 80% without noticeably affecting quality.
Sounds impressive. Until you look closely at the result.
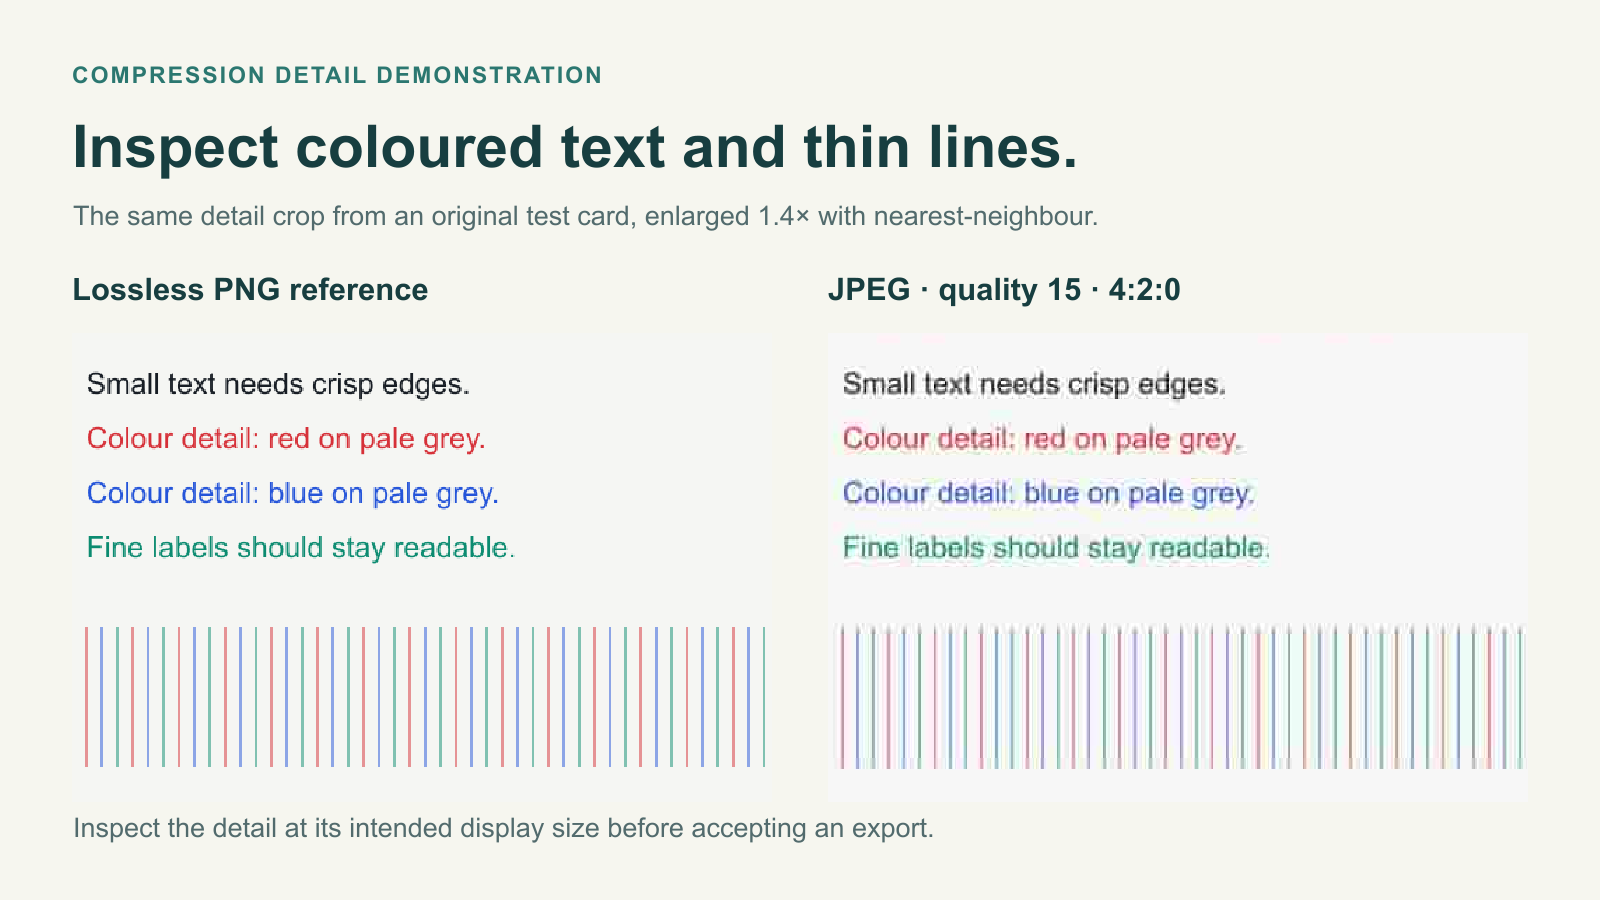
The product photograph is smaller, but the fabric texture has disappeared. The screenshot looks fine at first glance, but the text has developed a faint coloured fringe. The hero image loads quickly on your laptop, yet your mobile Largest Contentful Paint (LCP) score barely improves.
This is the problem with most image compression comparisons. They focus on how many bytes a tool removes, not what the website gains, or loses, in exchange.
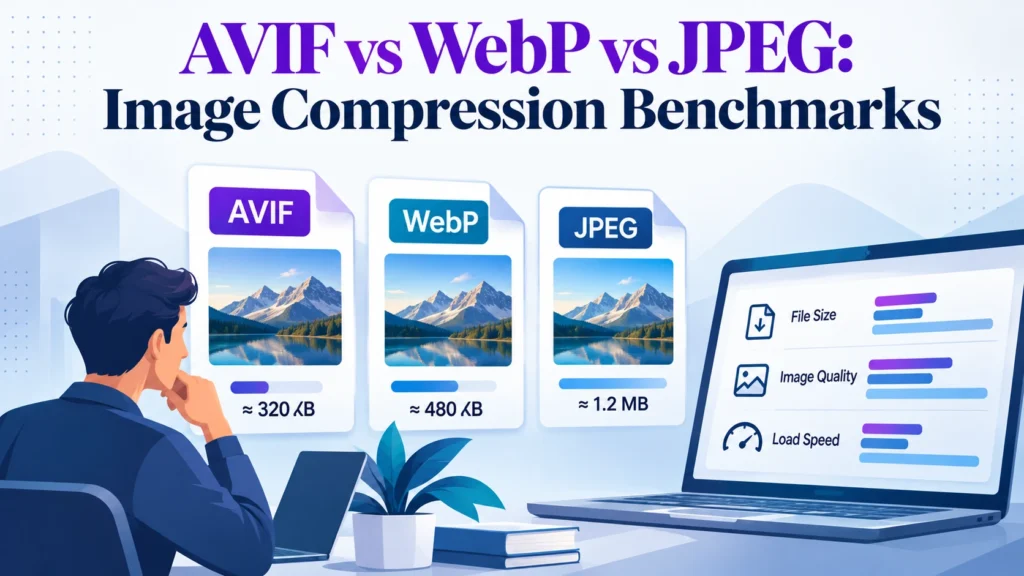
AVIF, WebP, and JPEG all have legitimate roles in modern image delivery. AVIF can deliver excellent compression efficiency, WebP offers broad compatibility and practical encoding performance, and JPEG remains a dependable fallback.
But choosing the best image compression format involves more than running one photograph through three encoders and comparing file sizes.
A proper benchmark should answer four questions:
How small can the image become without unacceptable visual damage?
How much processing time and infrastructure does compression require?
Does the result actually improve website loading performance?
Can the pipeline deliver consistent results across hundreds or thousands of assets?
In this guide, we’ll compare AVIF, WebP, JPEG, and PNG, explain which quality metrics are useful, and walk through a repeatable image compression benchmark.
We’ll also cover practical tools, common encoding mistakes, Core Web Vitals, and the operating costs that rarely appear in vendor comparisons.
Research note: This is a technical comparison and proposed testing methodology based on published codec documentation and performance guidance reviewed in November 2026. It does not present a new controlled benchmark performed by DigitalMarketingTools.ai. Any worked numerical examples are labelled illustrative, and third-party benchmark results are attributed to their publishers.
AVIF vs WebP vs JPEG: Which Image Format Should You Use?
For most modern websites, AVIF and WebP are both worth testing. Neither should be declared the universal winner without examining the images you’re serving.
AVIF often achieves smaller files at comparable visual quality, especially for photographic content. WebP remains a practical option because it is broadly supported, offers lossy and lossless encoding, and can be easier to incorporate into existing workflows.
JPEG still matters for compatibility and certain photographic workflows. PNG remains useful when lossless reproduction, screenshots, sharp graphics, or transparency are required.
Image format comparison
Format
Compression
Strengths
Main Trade-off
Suitable Use Cases
AVIF
Lossy and lossless
Excellent compression potential, transparency, high bit depth
Encoding cost, potential artefacts, compatibility with older clients
Hero images, product photography, large visual assets
May produce larger files than AVIF at comparable quality
Blog images, product images, general website assets
JPEG
Lossy
Very broad compatibility, mature tooling, progressive JPEG support
No transparency; often larger than newer alternatives
Photo fallbacks, legacy workflows
PNG
Lossless
Preserves exact pixel values and transparency
Large photographic files
Screenshots, diagrams, interface graphics
SVG
Vector-based
Sharp at different sizes, often efficient for simple graphics
Not suited to ordinary photographic imagery
Icons, logos, diagrams
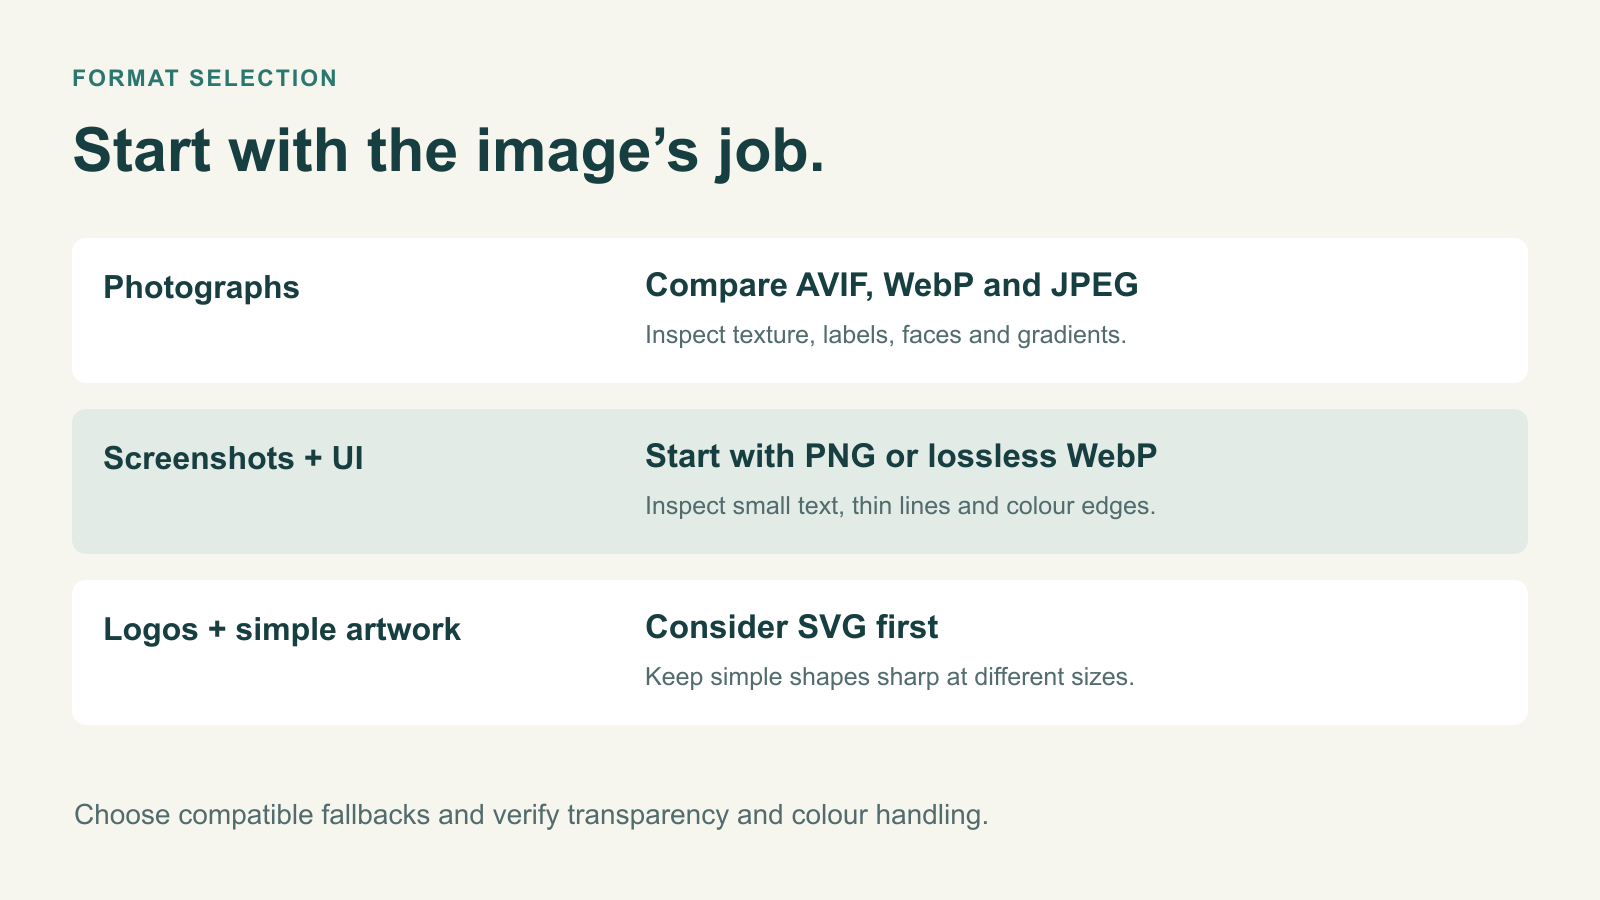
The practical starting point is simple:
For photographs: Compare AVIF, WebP, and an optimised JPEG.
For screenshots and UI graphics: Compare lossless PNG, lossless WebP, and suitable AVIF settings, inspecting text and edges.
For logos and simple illustrations: Consider SVG before converting to raster formats.
For older browser support: Keep a suitable JPEG or PNG fallback where necessary.
Google’s image format guidance and MDN’s image file type guide both recommend choosing formats according to the content, functional requirements, and available browser support.
The mistake is treating the format as the entire optimisation strategy.
A correctly sized WebP image may outperform an oversized AVIF. A lossless PNG may preserve a screenshot better than an aggressively compressed photograph-oriented output.
And an image format that reduces transfer size but makes every content update expensive to process may not be the best operational choice.
The Trade-off Nobody Publishes: Smaller Files Aren’t Automatically Better
Image compression vendors usually lead with a reduction percentage.
A tool might report that it turned a 1 MB JPEG into a 200 KB AVIF, a reduction of 80%.
That’s useful information, but it doesn’t establish that the output is better for your website.
Three questions are missing.
1. How much visual quality was sacrificed?
Compression works partly by representing image information more efficiently. Lossy compression also discards information.
What gets discarded matters.
A photograph with a softly blurred background may tolerate aggressive compression. A product photo containing labels, intricate textures, or fine edges may not.
The same settings can therefore produce very different visual results.
2. How long did the compression take?
AVIF encoding can be computationally expensive depending on the encoder, settings, and asset.
For a blog that publishes five images per week, a slower encoding process may be acceptable.
For an ecommerce platform processing thousands of image variations, the additional CPU time and queue management can become operationally significant.
The relevant cost isn’t just storage or bandwidth. It’s also the resources needed to generate and maintain the images.
3. Did the website become faster?
An image can be smaller without producing a meaningful improvement in Core Web Vitals.
If the browser discovers the hero image late, the server responds slowly, or render-blocking resources delay the page, compression alone may make little difference.
Similarly, image decoding and rendering behaviour can affect performance on actual devices.
The meaningful outcome is improved user experience at acceptable visual quality—not the largest compression percentage.
How AVIF and WebP Differ in Practice
AVIF: Better compression potential, more demanding decisions
AVIF uses AV1-based image compression and supports features such as transparency, high bit depth, and lossy or lossless output.
Its main attraction is compression efficiency.
According to Google’s image performance documentation, AVIF can deliver substantial savings compared with older formats, although results depend on the image and encoding settings.
A 2026 benchmark published by Smol for Mac compared image compressors across 24 Kodak photographs using matched SSIMULACRA2 quality scores. Its own AVIF output was reported as approximately 22–26% smaller than its JPEG output.
That is useful evidence of compression potential, not proof that AVIF always saves that percentage.
The benchmark was produced by a company selling one of the tools evaluated, used a particular photographic dataset, and depended on selected encoders and settings. Its results shouldn’t automatically be applied to screenshots, transparent graphics, or another encoder.
For teams considering AVIF, the questions are whether its additional size savings justify the encoding effort and whether the output preserves important visual details.
WebP: A practical middle ground
WebP provides lossy and lossless compression and supports transparency.
It is supported across current major browsers and can be relatively straightforward to integrate into content management systems, image processing libraries, and delivery services.
WebP may not achieve the smallest file in every comparison. But it can offer a useful balance between compressed output, visual quality, implementation complexity, and processing time.
That makes it an attractive default for many websites.
Its performance still depends on the selected encoder and configuration. WebP at a poor quality setting is not automatically better than a carefully optimised JPEG.
JPEG and PNG: Still relevant, not merely obsolete
JPEG remains useful for broad compatibility and existing photographic pipelines.
Modern JPEG encoders can also produce smaller or better-looking files than poorly configured alternatives, so an existing JPEG baseline deserves a fair test.
PNG is different because it is lossless.
It’s valuable when exact pixel reproduction matters, especially for charts, UI screenshots, and graphics with fine details.
However, storing large photographs as PNG can create unnecessarily heavy pages.
The useful question isn’t whether older formats should disappear. It’s whether each asset is being delivered in the most appropriate form for its purpose.
Why Comparing AVIF Quality 80 With WebP Quality 80 Is Misleading
This is one of the biggest problems in image compression benchmarks.
An encoder’s quality slider isn’t a standardised measure of visual quality across image formats.
Setting AVIF to quality 80 and WebP to quality 80 does not mean the two images contain equal amounts of visible detail.
Even two different AVIF encoders may interpret their settings differently.
Sharp’s documented WebP default quality is 80, while its AVIF default is 50. The encoder effort controls also have different ranges.
These values describe encoder behaviour, not equivalent perceptual quality.
What to compare instead
A more defensible benchmark compares the output files at:
The same pixel dimensions.
The same source image and crop.
A consistent colour management process.
Similar perceptual quality according to a suitable metric.
An acceptable level of visible artefacts confirmed by human review.
Only after those conditions are established should you compare file size and encoding speed.
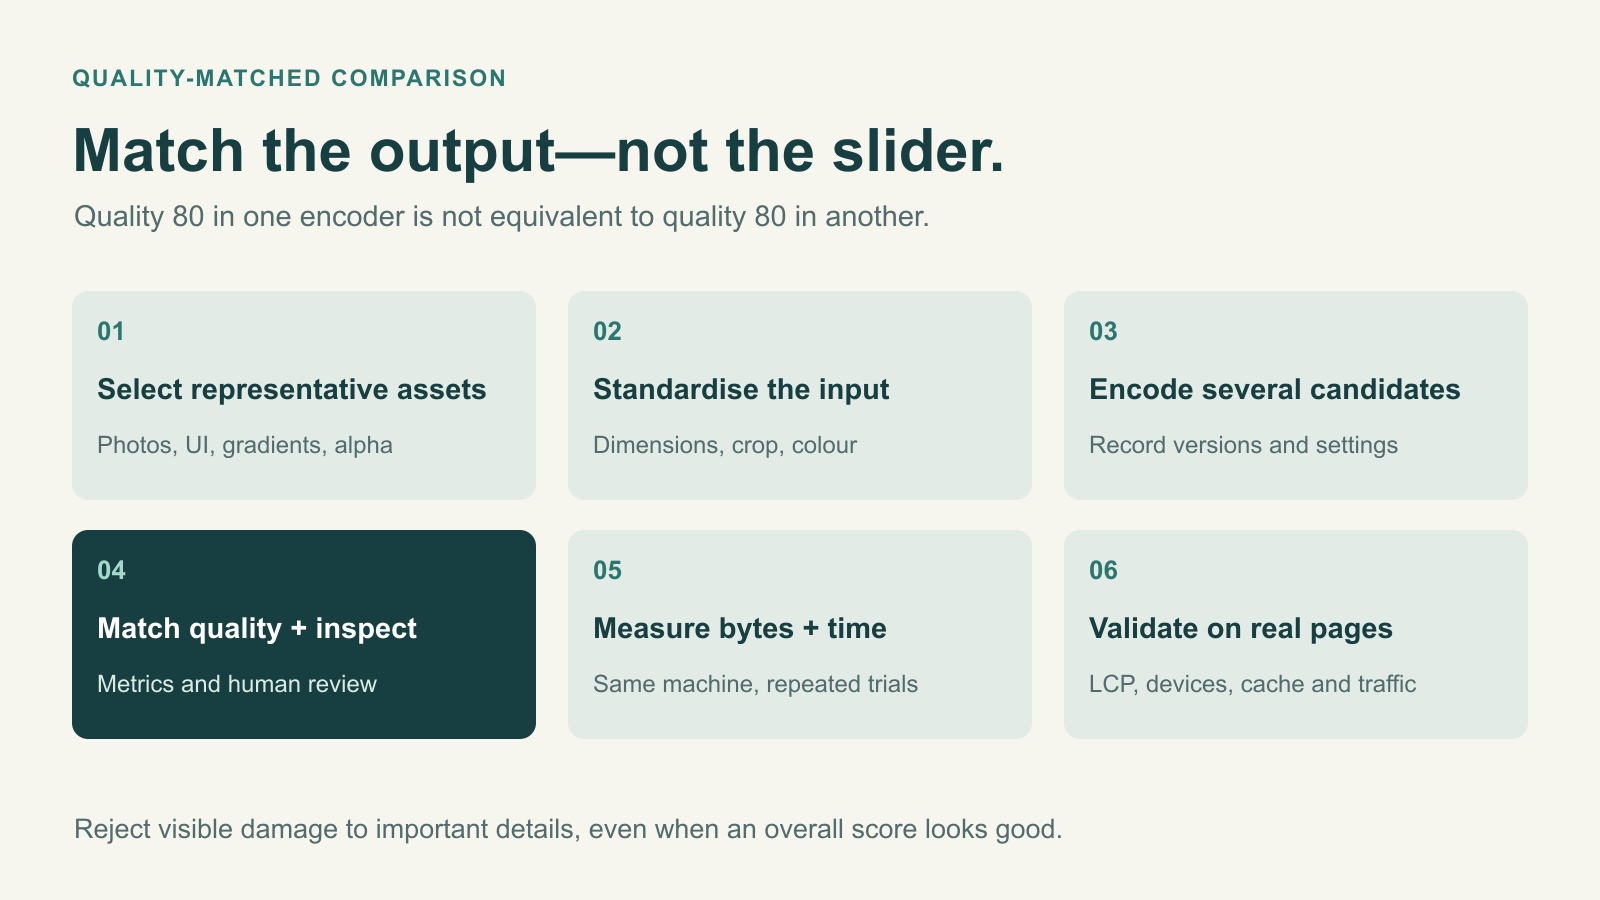
This is called a quality-matched comparison.
It answers a more useful question:
How many bytes does each format need to produce an image that looks acceptably similar to the original?
Which Image Quality Metrics Actually Matter?
No single metric perfectly reflects human perception.
However, several measurements can help make image compression benchmarks more repeatable.
Metric
What It Measures
Main Limitation
File size
Bytes required to store or transfer an image
Says nothing about visual quality
PSNR
Pixel-level differences expressed as signal-to-noise ratio
May not reflect human perception well
SSIM
Structural similarity between images
Can miss visually important artefacts
MS-SSIM
Structural similarity across different scales
Still an imperfect perceptual model
SSIMULACRA2
Perceptual image quality, including compression-related artefacts
Requires reference images and careful interpretation
Butteraugli
Perceptual differences and spatial artefact maps
Has limitations outside its intended distortion range
Human inspection
Whether visible differences matter to the intended user
Requires consistent viewing conditions and judgement
SSIM and MS-SSIM
Structural Similarity Index (SSIM) evaluates differences involving image structure rather than treating every pixel mismatch equally.
It’s useful for automated comparisons, but a high score doesn’t guarantee that a compressed image looks correct.
A small area containing important text or a product logo might be visibly degraded even when the overall image scores well.
MS-SSIM improves on the basic approach by evaluating structure at different scales.
It can be useful when working with different kinds of images, but should still be combined with visual inspection.
SSIMULACRA2
SSIMULACRA2 is designed to estimate perceived image quality and detect certain kinds of compression-related distortion.
It accounts for issues including smoothing and ringing artefacts.
Its scores generally move toward 100 as similarity to the reference improves, but the metric should not be treated as a universal pass/fail standard for every image category.
A score that works well for photography may not capture every practical problem in a screenshot or product image.
Butteraugli
Butteraugli estimates perceptual differences between images and can produce maps showing areas where those differences occur.
The original project’s documentation notes that it was tuned largely around relatively subtle distortions.
That limitation matters when testing extreme compression settings.
Human inspection is still essential
Automated scores are useful for narrowing down candidates.
But before changing a production image pipeline, inspect representative files at realistic display sizes.
Pay particular attention to product labels, skin texture, gradients, thin lines, small text, transparency, and brand colours.
An image can score well overall while damaging the exact detail a customer needs.
For a related discussion of image quality artefacts, see our guide to common image upscaling artefacts and how to fix them. Upscaling and compression are different processes, but some visible symptoms, particularly blur, halos, and damaged edges—deserve similar inspection.
How to Run a Fair AVIF vs WebP Compression Benchmark
You don’t need a research laboratory to run a useful benchmark.
You do need a consistent image set, controlled settings, and a clear definition of acceptable quality.
Here’s the process we’d recommend.
Step 1: Select a representative image set
Don’t use only one attractive photograph.
Build a test collection that reflects the images your website actually publishes.
A practical starting dataset might contain twenty images across five categories.
Image Category
Suggested Samples
What to Inspect
Product photographs
4
Fabric, packaging, labels, fine detail
Editorial photographs
4
Faces, hair, shadows, textures
Website hero images
4
Gradients, large visual regions, text overlays
Screenshots and UI graphics
4
Small text, thin lines, sharp edges
Transparent graphics and illustrations
4
Alpha edges, colour consistency, flat regions
This twenty-image collection is a proposed benchmark fixture, not a completed DMT test.
Store an untouched original for each asset, ideally before any previous lossy compression.
For example, a photo repeatedly downloaded from social media may already contain compression damage. Converting it again won’t restore missing information.
If the source needs enlargement rather than compression, review our free image upscaler limits guide before changing its dimensions.
Step 2: Standardise dimensions and colour handling
Before comparing formats, make sure the outputs have matching dimensions.
A 1,200 × 800 JPEG should not be compared with a 900 × 600 AVIF as though the reduction came from encoding alone.
The smaller image contains fewer pixels.
Also standardise or document:
Colour profile and conversion.
Bit depth.
Orientation.
Cropping.
Alpha handling.
Metadata removal.
Resampling method.
This is particularly important for product photography where colour accuracy matters.
An apparently smaller file is not a meaningful compression win if the process also changed the product’s appearance or silently resized it.
Step 3: Produce several quality levels
Generate multiple candidate outputs for each format rather than relying on one default.
For example, create a conservative, moderate, and more aggressive compression setting for each codec.
Record the exact encoder version and settings for every output.
The purpose is to develop a range of file sizes and visual-quality scores for each image.
Don’t treat identical numeric quality settings as equivalent between formats.
Step 4: Match perceptual quality
Decode the candidate outputs and compare them against the untouched reference using a suitable quality metric such as SSIMULACRA2.
For each source image, identify the smallest output from each format that meets your selected quality requirement.
Then visually inspect the candidates.
If one file damages an important label or loses an unacceptable amount of texture, reject it even if the overall metric meets the threshold.
For critical branded assets, preserve approved colours and details independently of an aggregate metric.
Our guide to maintaining consistent brand visuals discusses why visual consistency across an asset collection matters beyond isolated image quality.
Step 5: Measure file size and encoding time
Once the outputs are matched on quality, record their file sizes and processing times.
Use the same machine, software environment, and relevant hardware conditions.
Run repeated trials where possible and report the median rather than relying on one measurement.
If your application encodes images when users upload them, measure processing time under realistic concurrent workloads as well.
If your platform pre-generates images in background jobs, measure throughput and infrastructure usage.
Step 6: Test actual page performance
Finally, deploy representative image variants to a controlled staging environment.
Compare pages under the same conditions:
Viewport and device.
Network configuration.
Cache state.
Page structure.
Image discovery and loading priority.
Other network requests.
Then compare LCP and relevant loading measurements.
A smaller image should generally require fewer transfer bytes, but whether that improves the page’s user experience depends on the entire delivery process.
Image Compression Benchmark Results: What Your Table Should Show
A useful published benchmark should let readers inspect both the benefits and limitations of each configuration.
Rather than presenting an unsupported winner, record the results in a table like this.
Test Field
JPEG
WebP
AVIF
Source image and dimensions
Same source
Same source
Same source
Encoder and version
Record
Record
Record
Encoder quality setting
Record
Record
Record
Perceptual quality score
Measure
Measure
Measure
Output size (KB)
Measure
Measure
Measure
Median encoding time (ms)
Measure
Measure
Measure
Median decoding time (ms)
Measure
Measure
Measure
Visual inspection result
Pass / fail
Pass / fail
Pass / fail
Intended browser support
Verify
Verify
Verify
Populate this table separately for each image category, then summarise the distribution of results.
A median can be useful, but it shouldn’t hide images where a format performed particularly poorly.
Worked example: Why an AVIF win might not be worth switching
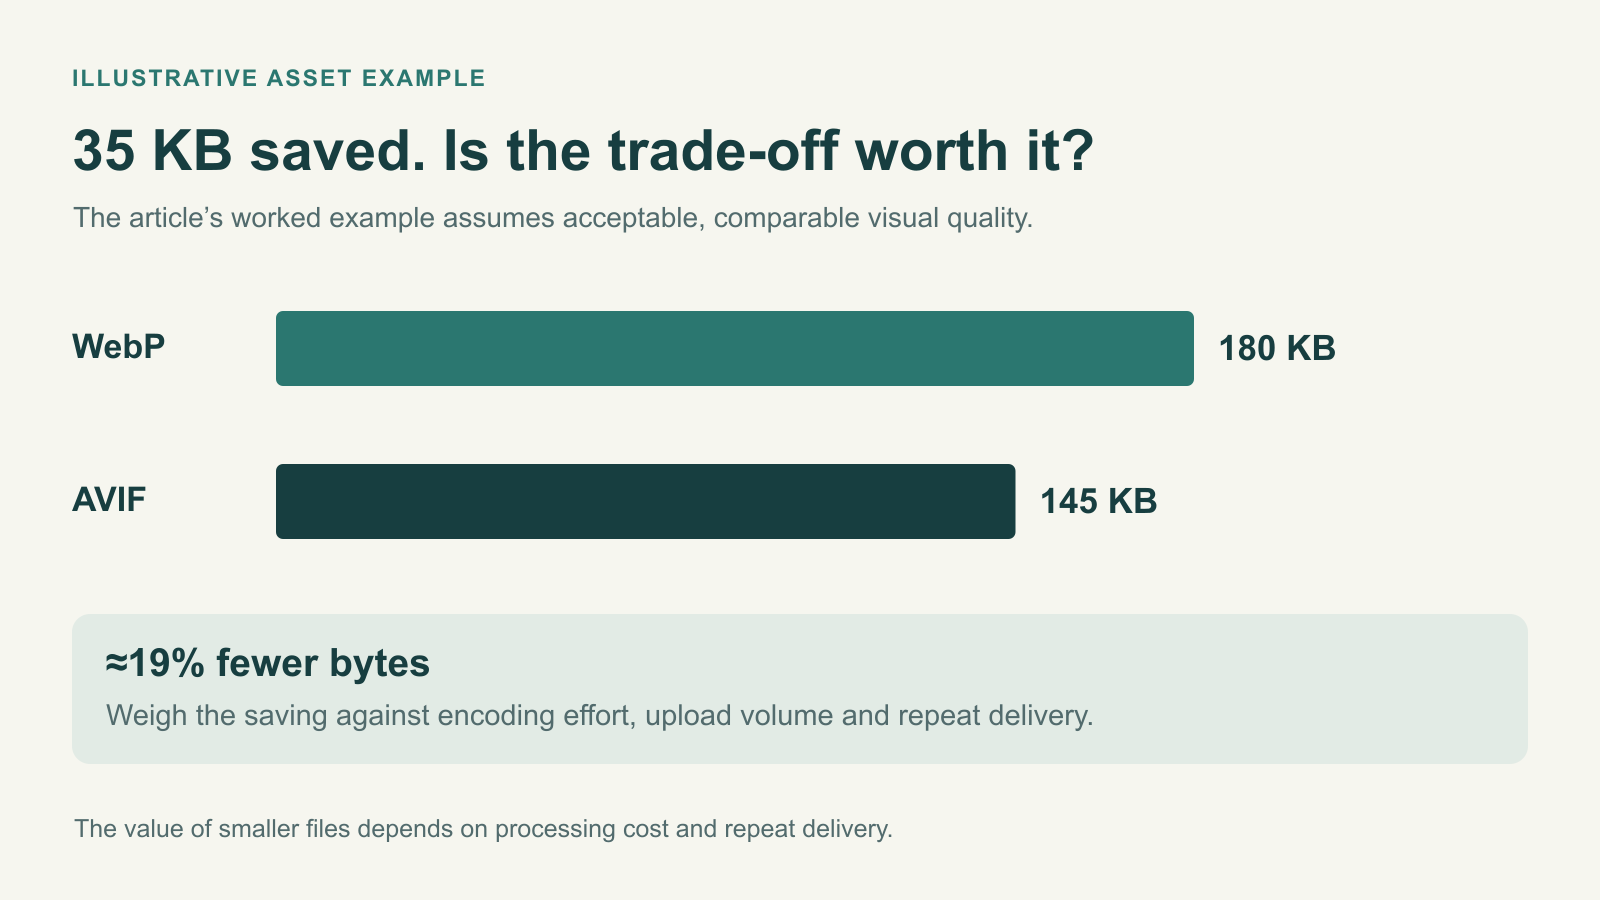
Consider a hypothetical website image that reaches acceptable visual quality at the following output sizes:
WebP: 180 KB.
AVIF: 145 KB.
AVIF saves approximately 19% compared with WebP for that asset.
If the AVIF encode also takes significantly longer and your server must process thousands of uploads in real time, the operational cost might outweigh those additional savings.
On the other hand, if the image is generated once and delivered to millions of users, the transfer reduction could be valuable.
These are illustrative file sizes, not DMT’s measured results.
The decision changes with upload volume, traffic, caching, and the image’s role on the page.
That’s why a complete benchmark needs both transfer efficiency and processing cost.
Image Compression and Core Web Vitals: What Actually Improves LCP?
Image compression can improve loading performance, but it is only one part of the equation.
Largest Contentful Paint measures when the largest relevant content element becomes visible to the user.
Google’s recommended LCP threshold is 2.5 seconds or less at the 75th percentile of page visits.
A smaller hero image can reduce download time, but it may not fix the other delays involved.
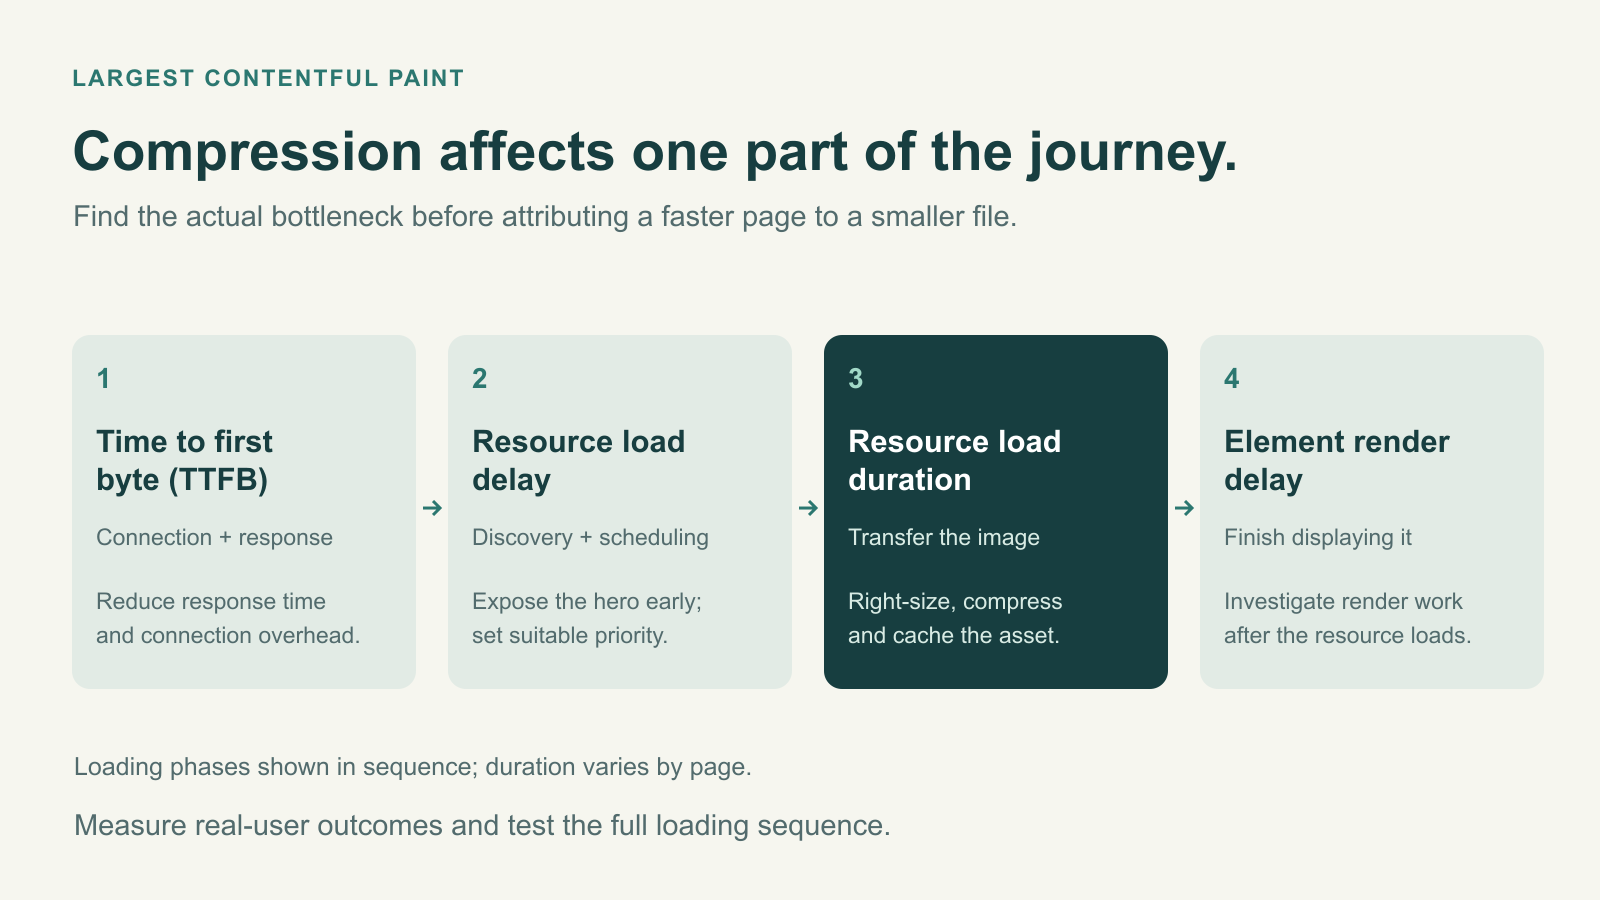
Google’s LCP optimisation guidance separates performance problems into several areas, including server response time, resource discovery, resource download duration, and rendering delay.
1. Serve correctly sized images
A mobile page displaying an image at 400 CSS pixels wide usually doesn’t need to download the same oversized image intended for a large desktop display.
Use responsive image variants and srcset so the browser can choose an appropriate size.
This can reduce unnecessary bytes before further codec optimisation.
2. Don’t lazy-load the main hero image
Lazy loading is valuable for images that appear farther down the page.
However, applying loading="lazy" to the primary above-the-fold hero image can delay when the browser begins downloading it.
For an image likely to be the LCP element, make it discoverable early and consider fetchpriority="high" where appropriate.
If the browser doesn’t know how much space an image will occupy, surrounding content may shift after the asset loads.
Specify intrinsic width and height attributes or use an appropriate CSS aspect ratio.
This helps protect Cumulative Layout Shift (CLS), another Core Web Vital.
4. Measure real users, not only Lighthouse
Lighthouse is useful for investigating a controlled page load.
But production performance should also be evaluated using field data from real users where available.
Different devices, connection speeds, browser versions, and cache states can produce different outcomes.
Monitor mobile and desktop performance separately, and avoid attributing every LCP change to image compression alone.
What about INP?
Interaction to Next Paint (INP) is another Core Web Vital.
Image compression primarily affects transfer size and related image processing, not every source of interaction delay.
However, heavy client-side image processing or decoding activity could compete for device resources under some conditions.
If compression or conversion happens in the browser, evaluate its impact on responsiveness as well as output size.
How to Deliver AVIF, WebP, and JPEG With Browser Fallbacks
Modern browsers widely support AVIF and WebP, but older clients and embedded browser environments may still require fallbacks.
The HTML <picture> element allows the browser to choose a supported format.
For example, a website can offer AVIF first, WebP second, and JPEG as the fallback.
A basic implementation looks like this:
<picture>
  <source srcset="/images/product.avif" type="image/avif">
  <source srcset="/images/product.webp" type="image/webp">
  <img
    src="/images/product.jpg"
    width="1200"
    height="800"
    alt="Product photographed against a neutral background"
  >
</picture>
The browser evaluates the available sources and chooses a suitable version according to support.
For production websites, combine this with responsive widths where appropriate.
Also ensure the image URLs resolve correctly, use the correct content types, and are cached consistently.
You don’t need to manually produce three copies of every image if your CDN or image delivery system already provides suitable automatic format negotiation.
However, automatic delivery should still be tested.
A feature labelled “automatic optimisation” doesn’t tell you whether the service has selected the best dimensions, preserved colour correctly, or used suitable encoding settings.
Tools for Testing and Implementing Image Compression
Different tools are appropriate for different parts of the workflow.
Has documented limitations and an archived original repository
CDN image transformation
Delivery-time format selection and resizing
Fees, cache behaviour and transformations need monitoring
Squoosh: Best for a quick visual comparison
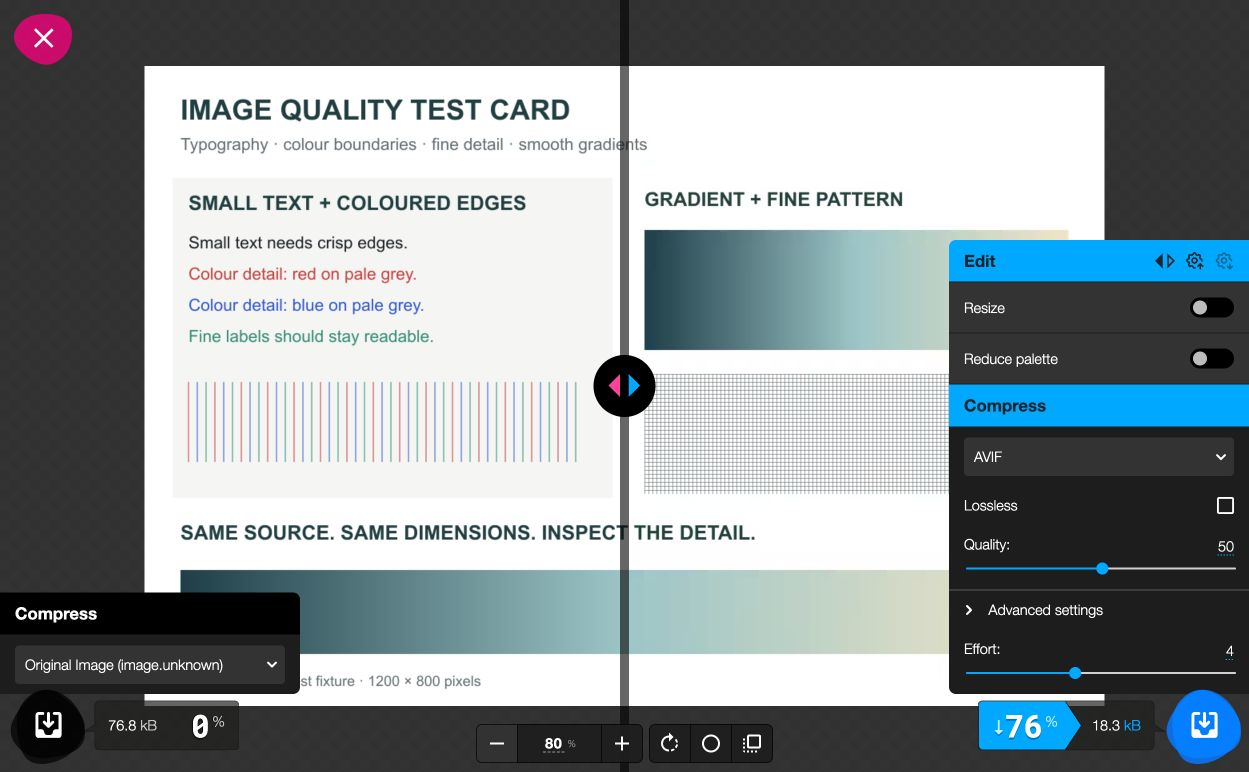
Squoosh is useful when you want to examine how an image looks under different formats and compression settings.
Its side-by-side interface makes visible artefacts easier to inspect than a table of file sizes alone.
According to its official project documentation, compression is processed locally in the browser rather than uploading source images to a remote conversion server. The application still collects certain basic analytics information.
For a small editorial team, this can be an effective way to identify suitable settings before investing in automation.
Sharp and libvips: Better suited to repeatable pipelines
Sharp provides image resizing and encoding functionality through a programmable interface and uses libvips.
It supports WebP and AVIF output with configurable quality and encoding effort.
That makes it useful for websites where the same processing rules need to be applied to many assets.
However, the result depends on the encoder version and configuration.
A pipeline that was optimised with one codec version should be rechecked after significant software updates.
Automated delivery: Convenient, but not exempt from testing
Image CDNs and content delivery platforms can resize images, negotiate formats, and cache transformed versions.
That reduces the need to maintain multiple static files manually.
However, transformation requests, cache misses, and format-specific variants can introduce their own infrastructure or billing considerations.
Ask whether the service charges by transformation, stored derivative, request volume, bandwidth, or a combination of these.
Convenience is valuable, but it should be included in the total cost calculation.
The Hidden Cost of Image Compression at Scale
Suppose your website publishes a few hundred images per month.
The difference between formats may be relatively easy to handle with a background processing workflow.
Now imagine you operate a marketplace receiving tens of thousands of product images, each requiring several responsive sizes.
Every additional output format increases the number of potential derivatives, unless the delivery system generates them on demand.
That creates decisions involving storage, compute, caching, invalidation, and processing time.
Cost per usable optimised image
For a production pipeline, a more meaningful measure than price per conversion is:
Cost per usable optimised image = Total processing and delivery-related costs ÷ Number of accepted images delivered
Include relevant costs such as processing infrastructure, transformation fees, storage, and operational review.
For a fair comparison, calculate the figure over the same period and workload.
An encoder that produces very small files but regularly requires manual correction may be more expensive than a slightly less efficient alternative that consistently produces acceptable output.
Time to first useful result
This is particularly relevant when comparing image compression products.
Record the time from opening the tool or configuring the pipeline to producing the first asset that meets your size, quality, and format requirements.
For a browser utility, this may take only a short manual workflow.
For a build-time processing system, setup may require engineering work before the first successful export.
Treat those scenarios separately rather than pretending the same evaluation conditions apply.
Common Image Compression Mistakes to Avoid
Comparing different image dimensions
A smaller output resolution can create dramatic file-size reductions unrelated to codec efficiency.
Always document whether the benchmark holds dimensions constant.
Comparing identical quality numbers
Quality 75 in one encoder doesn’t mean the same thing as quality 75 in another.
Use perceptual metrics and visual review to match the outputs.
Recompressing already damaged images
A low-quality JPEG may already contain visible artefacts.
Saving it as AVIF doesn’t restore information that was discarded earlier.
Whenever possible, compress from the original high-quality source.
Ignoring screenshots and text
Photograph-oriented settings can damage small typography, line charts, and interface elements.
Test screenshots separately and consider lossless or less aggressive encoding.
Optimising bytes but ignoring page loading
If your hero image is discovered late or lazy-loaded, reducing its size may not resolve the primary LCP problem.
Review the complete loading sequence.
Ignoring colour changes
Profiles, conversions, and chroma subsampling can affect how colours and fine colour boundaries appear.
This matters for product imagery, brand assets, and graphics with coloured text.
Trusting one attractive benchmark image
A format that performs well on a simple photograph may struggle with detailed textures, gradients, or screenshots.
Always use a representative collection.
How We Evaluate Image Compression Tools
At DigitalMarketingTools.ai, we believe compression tools should be assessed on their ability to produce useful, repeatable results rather than simply advertise the largest percentage reduction.
A proposed image compression evaluation should consider:
Evaluation Criterion
Suggested Weight
What It Measures
Visual quality
25%
Artefacts and fidelity at intended viewing sizes
File-size efficiency
25%
Bytes required at comparable perceptual quality
Processing performance
15%
Encoding time, throughput, and resource use
Output control
15%
Format, dimensions, metadata, colour and transparency handling
Workflow reliability
10%
Batch completion, errors, repeatability, and integrations
Total operating cost
10%
Software, infrastructure, and manual correction effort
These are proposed editorial weights, not scores from completed product testing.
A different use case may require different priorities.
For example, a news publisher might place greater emphasis on throughput and delivery performance. A product photography team might prioritise colour accuracy and fine-detail preservation.
When testing tools, we would document the source images, selected configurations, encoder versions, environment, quality measurements, and failed cases.
Results should be identified as either hands-on tested, documentation-reviewed, or not evaluated.
Our Editorial Methodology describes the site’s proposed review principles. The page is currently marked as a draft awaiting approval, so it should not be interpreted as proof that every proposed benchmark has already been completed.
Final Verdict: Choose the Smallest File That Still Does the Job
AVIF can deliver excellent compression efficiency. WebP offers a strong balance of compatibility, compression, and workflow practicality. JPEG and PNG still have roles where compatibility or fidelity matters.
But no format wins every use case.
For a content-heavy website, the right strategy may involve AVIF for suitable hero and photographic assets, WebP for broad delivery, and carefully selected fallbacks.
For ecommerce, preserving product details and colour accuracy may be more important than achieving the smallest possible file.
For a large media library, encoding time, storage, transformation costs, and the reliability of batch processing may become major factors.
The sensible way to decide is to benchmark a representative image set at matched perceptual quality, inspect important visual details, measure processing costs, and validate performance on real pages.
Don’t optimise your website for a compression percentage.
Optimise it for images that look right, load efficiently, and can be delivered reliably at scale.
That’s the trade-off worth measuring.
Frequently Asked Questions
Is AVIF better than WebP for image compression?
AVIF can produce smaller files at comparable perceptual quality, particularly for photographic images, but it may require more encoding effort. WebP offers broad compatibility and practical production workflows. Test both using your own images.
Does AVIF improve Core Web Vitals?
It can help reduce transfer size, which may improve loading performance and LCP. However, the result depends on image dimensions, discovery, server response, caching, decoding, and rendering. AVIF alone doesn’t guarantee a better Core Web Vitals score.
How much smaller is AVIF than WebP?
There is no universal percentage. Results depend on image content, encoder versions, quality settings, and the definition of comparable visual quality. Published benchmarks may show substantial savings for particular datasets, but those figures shouldn’t be generalised to every website.
Is WebP still worth using in 2026?
Yes. WebP remains widely supported and efficient, with lossy and lossless modes and transparency support. It can be a practical default for many websites even when AVIF achieves smaller files in some comparisons.
Should I convert every PNG to AVIF?
No. Some PNG files contain screenshots, diagrams, sharp text, transparency, or graphics that require lossless accuracy. Test whether the conversion preserves those characteristics before replacing them.
What is the best image quality metric?
SSIM, MS-SSIM, and SSIMULACRA2 are useful for different aspects of comparison. None perfectly reflects human perception in every situation. Combine quantitative measurements with visual review of representative images.
Does a smaller image always load faster?
Not necessarily. A smaller file generally reduces bytes transferred, but the complete page load also depends on network conditions, caching, resource discovery, priority, decoding, and rendering.
Is Squoosh good enough for image compression?
Squoosh is useful for manual comparisons, visual previews, and occasional conversions. For high-volume production, an automated pipeline using a library or image delivery service may be more suitable.
Should I use JPEG as a fallback?
JPEG remains useful as a broadly compatible fallback for photographic content. PNG is generally more appropriate where transparency or lossless reproduction is required.
How often should an image compression pipeline be benchmarked?
Recheck it after meaningful encoder updates, changes to image delivery infrastructure, new asset categories, or noticeable shifts in page performance. Regularly reviewing a representative sample is more useful than assuming one configuration remains optimal forever.
About the author
Tom Koh
Tom is the CEO of MediaOne, a leading digital marketing agency. He is a business-experienced SEO consultant as well as a Google Gold Search Expert serving the international community. He has consulted for MNCs like Canon, Maybank, Capitaland, SingTel, ST Engineering, WWF, Cambridge University, as well as Government organisations like Enterprise Singapore, Ministry of Law, National Galleries, NTUC, e2i, SingHealth. His articles are published and referenced in CNA, Straits Times, MoneyFM, Financial Times, Yahoo! Finance, Hubspot, Zendesk, CIO Advisor. Under his stewardship, MediaOne has won dozens of prestigious digital marketing awards.
Your website has 150 published articles. Some attract consistent organic traffic, others haven’t generated a meaningful visit in months, and several cover nearly identical…
Writing a good advertisement sounds simple until you have to create 15 different headlines, stay within character limits, communicate your product’s benefits, and make…
Verifiability matters more than speed when publishing AI-generated content. An AI content generator turns a short brief into draft copy, and its usefulness depends…