Every landing page builder promises faster pages, higher conversion rates, and an easier way to turn advertising clicks into customers. Unbounce promotes conversion optimisation, Instapage highlights its rendering technology, and platforms such as Webflow and Framer emphasise performance-oriented website building.
Those features sound useful, but they don’t establish which platform will perform best for your actual advertising campaign.
A landing page can achieve an excellent PageSpeed Insights score and still fail to generate leads because the offer is unclear, the form asks too many questions, or the message doesn’t match the advertisement. Another page might have a lower synthetic performance score but generate more qualified enquiries because visitors understand exactly what they’re getting.
For paid media teams, these differences have a direct financial impact. Every unnecessary delay, broken form, or confusing conversion step creates another opportunity to lose someone you’ve already paid to reach.
The best landing page builder isn’t necessarily the fastest in a vendor demonstration. It’s the one that delivers a consistently responsive experience and turns relevant advertising traffic into measurable business outcomes.
This guide compares six landing page builders, explains how to measure Core Web Vitals on equivalent pages, and provides a practical methodology for testing conversion performance without confusing platform features with verified results.
We focus on two questions: How quickly can visitors use the page, and how effectively does it convert? Features, pricing, and workflow complexity matter only insofar as they affect those outcomes.
Editorial note: This article provides a research-backed evaluation framework and a comparison of vendor-documented capabilities. DigitalMarketingTools.ai has not published a controlled, identical-page performance benchmark or paid-traffic conversion experiment across the six builders discussed. All numerical testing examples are illustrative.
Measure real-user speed, not just a PageSpeed score. Core Web Vitals evaluate loading performance, responsiveness, and visual stability, while Lighthouse helps diagnose potential problems.
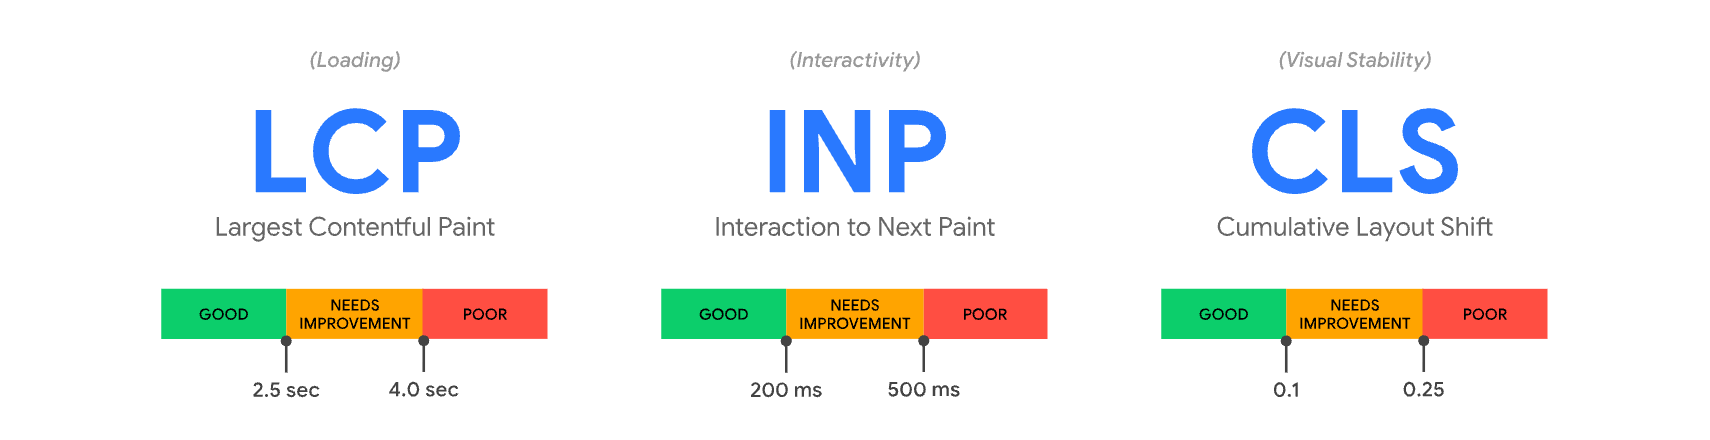
Google’s recommended thresholds are LCP at 2.5 seconds or less, INP at 200 milliseconds or less, and CLS at 0.1 or less, measured at the 75th percentile of real-user experiences.
Compare equivalent landing pages before comparing builders. Different images, tracking scripts, forms, and hosting configurations can overwhelm the platform differences you’re trying to measure.
Unbounce, Instapage, and Leadpages offer integrated landing page experimentation, while Webflow and Framer provide broader design workflows with dedicated testing capabilities.
WordPress with Elementor gives teams greater control over hosting and plugins, but that flexibility also introduces more performance variables.
A fast page doesn’t guarantee a higher conversion rate. Traffic quality, message match, form usability, and the offer itself must be controlled or measured separately.
The final purchasing decision should consider cost per qualified lead and time to maintain a performant page, rather than relying on the builder’s advertised conversion uplift.
Why Load Speed and Conversion Should Be Evaluated Together
Landing page performance is often divided between two teams.
Developers examine loading times, network requests, JavaScript, and Core Web Vitals. Paid media specialists examine conversion rates, cost per lead, campaign performance, and return on ad spend.
Both perspectives are necessary, but evaluating them separately can lead to misleading conclusions.
A technically fast landing page might display a complicated form that discourages visitors from submitting it. Meanwhile, a page with persuasive messaging might initially convert well but become slower as marketers add analytics tags, personalisation scripts, videos, and other features.
The challenge isn’t simply making a page load quickly. It’s keeping the experience responsive and dependable while including the elements needed to convert visitors.
Why Speed Matters for Paid Advertising
Unlike someone exploring a website organically, a visitor arriving from a paid advertisement may have a specific expectation formed by the ad’s message.
If the landing page takes too long to display its main content, delays the form, or becomes difficult to interact with, the visitor may leave before completing the intended action.
Google also considers landing page experience within its broader assessment of advertising quality. Its guidance emphasises relevance, usefulness, and ease of navigation.
However, this shouldn’t be reduced to a claim that improving a Lighthouse score automatically reduces cost per click.
Google explains in its ad quality documentation that the displayed 1–10 Quality Score is a diagnostic measurement rather than a direct input to the ad auction.
Page speed is one important part of the experience, but conversion performance depends on more than speed alone.
Which Landing Page Speed Metrics Actually Matter?
A fair comparison begins with clear measurement definitions.
Google’s Core Web Vitals provide established benchmarks for understanding real-user loading performance, responsiveness, and visual stability.
The current metrics are Largest Contentful Paint (LCP), Interaction to Next Paint (INP), and Cumulative Layout Shift (CLS).
Metric
What It Measures
Good Threshold
Why It Matters for Landing Pages
Largest Contentful Paint (LCP)
Time until the main visible content appears
2.5 seconds or less
Visitors can see the offer and primary message
Interaction to Next Paint (INP)
Responsiveness to user interactions
200 milliseconds or less
Forms, buttons, and controls respond promptly
Cumulative Layout Shift (CLS)
Unexpected movement of visible content
0.1 or less
Visitors can interact without elements shifting
Time to First Byte (TTFB)
Time until the browser receives the first response byte
800 milliseconds or less is Google’s good diagnostic target
The first three are Core Web Vitals. TTFB is a useful diagnostic measurement, while TBT is a laboratory metric rather than a replacement for real-user INP.
Google recommends assessing Core Web Vitals at the 75th percentile, separately for mobile and desktop traffic.
For example, a landing page with a mobile LCP of 2.3 seconds at the 75th percentile meets the recommended loading threshold. A page with 3.4 seconds does not, even if some visitors experience much faster loading.
LCP: How Quickly Can Visitors See the Main Offer?
Largest Contentful Paint measures when the largest relevant content element becomes visible within the viewport.
For a landing page, that element might be the hero image, a large heading, or another prominent content block.
A builder that displays the page background quickly but delays the main message may create the impression of loading progress without delivering useful content.
When reviewing LCP, inspect which element is being measured. An oversized hero image, delayed font rendering, or unnecessary JavaScript can all contribute to slow loading.
INP: Does the Page Respond When Someone Tries to Convert?
Interaction to Next Paint measures responsiveness during user interactions.
On a landing page, poor responsiveness may become noticeable when someone tries to open a form, select an option, click a button, or complete an interactive section.
A page can appear visually loaded while JavaScript continues to occupy the browser’s main thread.
This is particularly relevant when builders load several third-party scripts or complex interactive components.
However, standard Lighthouse navigation tests cannot directly measure field INP because they don’t reproduce the full range of real-user interactions. Use field monitoring and appropriate interaction testing rather than assuming a good Lighthouse score proves responsiveness.
Imagine someone is about to click a landing page’s primary CTA when an image, embedded video, or third-party widget loads and pushes the button downward.
That movement can create frustration or lead to an unintended interaction.
Common sources include images without reserved dimensions, late-loading banners, web fonts, and embedded content that changes size.
The goal isn’t merely making elements look stable during a screenshot. The page should remain usable as content and scripts finish loading.
Why a High PageSpeed Insights Score Isn’t Enough
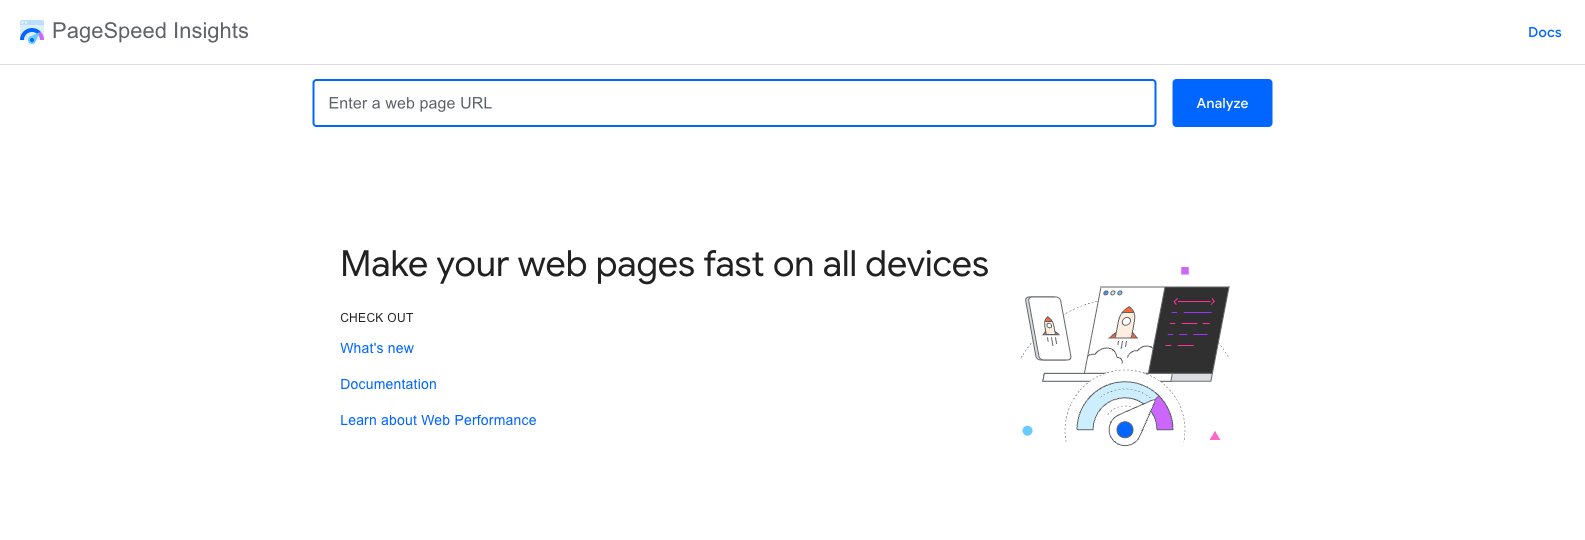
Google PageSpeed Insights combines laboratory testing through Lighthouse with real-user data from the Chrome User Experience Report (CrUX), when sufficient data is available.
These datasets serve different purposes.
Laboratory results use a controlled testing environment to identify potential performance problems. They are useful for comparing implementations and diagnosing scripts, images, fonts, and other page resources.
Field results reflect measurements collected from actual Chrome users over a rolling 28-day period. These are more representative of real visitor experiences, although they depend on available traffic and may include variations in devices, networks, and user behaviour.
A newly published landing page may have no URL-level CrUX data because it hasn’t received enough eligible traffic.
When PageSpeed Insights displays origin-level measurements instead, those figures may reflect other pages on the same website rather than the specific landing page being evaluated.
That makes it important to identify which data you’re actually reading.
What About the Lighthouse Performance Score?
A Lighthouse score of 95 doesn’t automatically prove that a landing page is faster for every visitor than another page scoring 85.
Synthetic scores can change between runs because of testing conditions, simulated devices, and resource availability.
They also summarise several measurements into one number, which can hide the underlying cause of performance problems.
For builder comparisons, record the individual metrics, repeat the laboratory tests, and examine the actual page resources.
Once the campaign has sufficient real traffic, use field measurements to validate whether the performance observed in the laboratory reflects what visitors experience.
Six Landing Page Builders Worth Comparing
The following platforms offer different combinations of landing page creation, hosting, analytics, and conversion testing.
Rather than assigning unverified speed rankings, we’ve identified the specific capabilities and limitations that should be evaluated on equivalent pages.
Builder
Main Advantage
Conversion Testing
Important Performance Consideration
Unbounce
Dedicated paid-campaign landing pages
Native A/B testing and Smart Traffic
Script load, mobile variants, and routing behaviour
Instapage
Post-click advertising and experimentation
Server-side A/B testing
Rendering performance and tracking integrations
Leadpages
Landing pages with integrated conversion tracking
A/B testing on eligible plans
Forms, external scripts, and plan capabilities
Webflow
Design flexibility and managed hosting
Webflow Optimize
Interactions, animations, and additional testing features
Framer
Visual design and performance-focused publishing
Convert A/B testing add-on
Interactive components and attribution window
WordPress + Elementor
Hosting and plugin control
External or separately configured testing
Hosting, theme, caching, and plugin overhead
The comparison describes documented functionality, not the results of identical-page testing. Each product should be assessed using the same page requirements and measurement conditions before claiming one is faster or converts better.
1. Unbounce: Built for Paid Traffic and Conversion Experiments
Unbounce is a dedicated landing page platform with drag-and-drop editing, custom mobile layouts, forms, dynamic text replacement, and built-in experimentation.
Its central advantage for paid media teams is that page creation and conversion testing are part of the same workflow.
Marketers can build a landing page, create variations, allocate traffic, and examine how those versions perform without maintaining a separate website development process.
Unbounce also offers Smart Traffic, which dynamically routes visitors toward page variations based on available visitor attributes.
What to Test for Load Speed
Unbounce supports custom scripts, tracking integrations, popups, and other conversion features.
These are useful, but every additional resource creates something worth measuring.
Build an equivalent landing page and check how the published output handles hero images, forms, fonts, third-party scripts, and mobile layouts.
Also confirm that the measurement includes the same tracking configuration that the live campaign would use.
A stripped-down page without analytics tags may load quickly, but it doesn’t represent the complete production workflow.
This is useful for comparing different headlines, offers, forms, or page layouts within the platform.
However, Smart Traffic should be treated differently from a conventional randomised A/B test.
Because its purpose is to route visitors toward versions expected to perform well for their characteristics, the resulting traffic groups may not remain equivalent to a simple random split.
Use a controlled test when evaluating a specific causal hypothesis, and evaluate automated routing as a separate optimisation workflow.
Best fit: Paid media teams that regularly build campaign-specific landing pages and run controlled conversion experiments.
2. Instapage: Built for Post-Click Campaign Optimisation
Instapage focuses on landing pages designed for paid advertising campaigns, with experimentation, analytics, and integrations for measuring post-click performance.
Its feature set includes server-side A/B testing, heatmaps, conversion analytics, and tools for creating or managing multiple landing page variations.
Instapage also promotes its Thor Render Engine, designed to improve how published pages deliver HTML, CSS, JavaScript, and media resources.
These are relevant performance features, but their existence doesn’t establish that an Instapage page will outperform an equivalent page built elsewhere.
What to Test for Load Speed
Publish a production-equivalent page and examine its Core Web Vitals and resource loading behaviour.
Pay particular attention to how the hero section renders, how third-party scripts are loaded, and whether custom components introduce additional blocking resources.
Instapage’s rendering technology should be evaluated through observed results rather than historical claims about performance improvements.
Vendor demonstrations may use different page structures, assets, devices, or testing periods than your actual campaign.
What to Test for Conversion
Instapage supports experiments that serve variations through a single test URL, with traffic distributed according to the configured experiment.
Its documentation explains that the experiment feature is available only on eligible subscriptions.
A meaningful test should use the same conversion goal across variations and confirm that form submissions or other actions are counted consistently.
The platform’s Google Ads and Analytics integrations can support reporting, but advertisers should verify that the measurements align with their actual advertising conversion setup.
Best fit: Teams running substantial paid campaigns that need campaign-specific pages, structured experimentation, and post-click analytics.
3. Leadpages: Built for Lead Generation and Accessible A/B Testing
Leadpages provides a visual landing page builder with forms, integrations, hosting, analytics, and conversion experiments.
Its workflow is especially relevant to lead-generation campaigns where the primary conversion is a form submission or another straightforward user action.
Leadpages’ current Grow plan includes A/B testing, while higher subscriptions add features such as heatmaps and automated traffic optimisation.
What to Test for Load Speed
Start with a simple lead-generation page containing a headline, supporting copy, hero visual, and form.
Measure the published page before adding additional tracking and marketing integrations. Then repeat the tests using the complete production configuration.
This will help identify whether form scripts, embedded widgets, or third-party tags materially affect loading and responsiveness.
Because the platform offers managed hosting, the results will also reflect its delivery infrastructure rather than only the visual editor.
What to Test for Conversion
Leadpages supports experiments involving form submissions, link clicks, purchases, and certain offsite conversion actions.
For lead-generation campaigns, verify that a recorded form submission represents a successful submission rather than merely a button click.
Its documentation also distinguishes between total visits, unique visits, and conversions, which matters when calculating conversion rates.
Before committing, verify the plan required for A/B testing and any advanced optimisation features. Leadpages currently advertises its Grow plan at $99 per month, with additional capabilities on higher tiers.
Best fit: Small businesses and lead-generation marketers seeking a connected landing page and conversion-testing workflow.
4. Webflow: Built for Design Control and More Complex Campaign Pages
Webflow combines a visual website development environment with managed hosting, responsive design controls, and broader content management functionality.
For businesses producing landing pages that must closely match an existing website or support more complex layouts, Webflow offers flexibility beyond a narrowly defined campaign-page editor.
It also provides Webflow Optimize, which supports A/B testing, personalisation, and AI-assisted optimisation.
What to Test for Load Speed
Webflow’s performance depends partly on the page being created.
A simple page with compressed images, limited interactions, and carefully managed fonts may behave differently from a visually elaborate page with multiple animations and third-party embeds.
The comparison should therefore include the actual interactions required by the campaign, not a simplified design chosen only to maximise a performance score.
Webflow’s managed hosting, caching, and content delivery infrastructure are relevant, but they’re only part of the final result.
What to Test for Conversion
Webflow Optimize can test page variations and support personalised experiences.
However, personalisation and conventional A/B testing answer different questions.
If the goal is to determine whether one landing page design converts better than another, use a consistent controlled experiment.
If the goal is to tailor different messages to different audiences, the evaluation should also examine whether the personalisation logic accurately identifies those audiences.
For teams not using the dedicated optimisation product, conversion measurement and experimentation may require an additional setup.
Best fit: Businesses needing flexible page design and a wider website workflow alongside paid-campaign optimisation.
5. Framer: Built for Visually Polished Landing Pages
Framer provides a visual publishing environment with responsive layouts, hosting, analytics, and interactive design capabilities.
Its appeal is particularly strong when marketers want polished campaign pages without building a conventional development workflow from scratch.
Framer also provides built-in A/B testing through its Convert add-on, allowing users to compare up to five page variations.
What to Test for Load Speed
Framer’s performance guidance describes automatic image optimisation and recommendations for managing fonts and other page resources.
These features can simplify performance work, but they don’t remove the need to test the final page.
Animations, custom components, embeds, and external scripts can affect the experience visitors receive.
Run repeated mobile laboratory tests and inspect any issues affecting the hero content, interaction responsiveness, and visual stability.
What to Test for Conversion
Framer supports experiments using tracked link clicks, form submissions, and page visits.
Its A/B testing distributes visitors across variants and provides conversion analysis.
However, an important limitation appears in its current documentation: the experiment’s anonymous visitor identifier resets daily, and conversions can only be attributed within the same day.
That may be sufficient for simple, immediate on-page actions, but it requires closer consideration for campaigns where visitors return later or convert through longer journeys.
The Convert add-on is available for eligible Pro or Enterprise sites and uses event-based billing.
Best fit: Design-focused teams producing visually polished campaigns with relatively straightforward conversion actions.
6. WordPress With Elementor: Built for Teams That Need Hosting Control
Elementor provides visual page building within WordPress.
Unlike a fully hosted landing page product, a self-hosted WordPress implementation gives the business more control over hosting, caching, plugins, themes, and technical optimisation.
That flexibility can be useful, but it makes comparison more complicated.
A page built with Elementor on a well-configured hosting environment may perform very differently from one using the same builder with overloaded shared hosting, an unnecessarily heavy theme, and numerous plugins.
What to Test for Load Speed
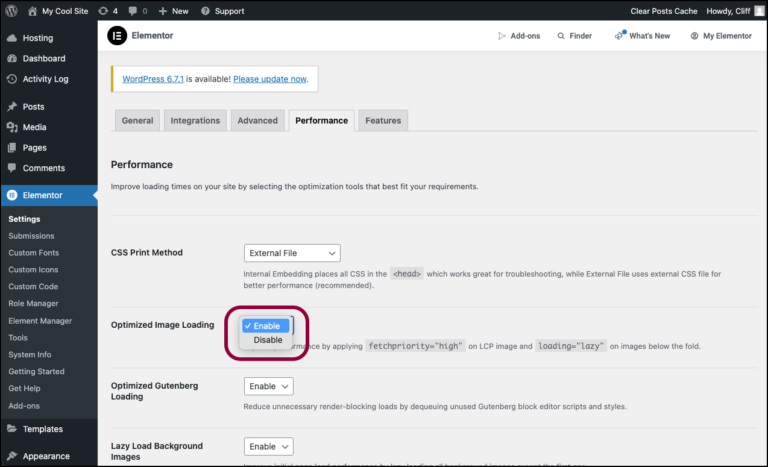
Elementor’s current performance features include optimised image loading, inline font icons, lazy loading, and element caching.
Its performance documentation also explains how certain features can reduce unnecessary loading or improve delivery.
However, these capabilities need to be configured appropriately.
When testing Elementor, document the hosting provider, WordPress theme, active plugins, caching, CDN configuration, and image optimisation settings.
Without this information, the result cannot be attributed meaningfully to the page builder.
What to Test for Conversion
Elementor can support landing page forms and integration with external analytics or marketing services.
However, controlled A/B testing may require additional software or a separately managed experiment.
This introduces more configuration work than a platform with integrated testing and reporting.
It also creates more opportunities for inconsistent event tracking if the form, analytics, and advertising integrations are configured separately.
Best fit: Businesses already operating on WordPress, particularly when they have the technical resources to maintain hosting performance and conversion tracking.
How to Compare Landing Page Builders Fairly
A credible performance comparison should begin with equivalent pages, not a collection of each vendor’s most impressive demo templates.
Otherwise, a builder may appear faster simply because its demonstration contains fewer images, simpler typography, or less tracking code.
A practical methodology has two stages: a controlled technical comparison and a real campaign evaluation.
Step 1: Create One Standard Landing Page Brief
Choose a realistic campaign, such as a lead-generation page for a software product or professional service.
Every builder should receive the same content and functional requirements.
For example, the test page might include a headline, supporting paragraph, compressed hero image, three benefits, testimonials, one lead-generation form, and a confirmation state.
Use the same copy, image assets, fonts where possible, number of form fields, CTA wording, and general page structure.
The objective is to minimise differences that don’t come from the implementation.
Step 2: Match the Production Configuration
Testing an empty template doesn’t reveal how the page will behave once the campaign goes live.
Use the same analytics tags, consent-management requirements, media assets, and essential integrations across the builders wherever technically possible.
Also document the hosting arrangement, domain setup, and caching configuration.
For WordPress, this includes the server and plugin stack. For hosted builders, the delivery environment is largely managed by the provider.
If exact implementation parity isn’t possible, record the difference instead of silently modifying the page requirements.
Step 3: Run Repeated Laboratory Tests
Use PageSpeed Insights or Lighthouse to examine each published page under controlled conditions.
A practical exploratory benchmark might involve five runs per page on mobile and five on desktop, with consistent settings.
This is a suggested testing procedure, not a statistically complete benchmark.
Record the individual results and their median values rather than selecting the best run for each platform.
Also check the size and number of page resources so differences can be investigated.
Step 4: Compare Cold and Repeat Visits
A first-time visitor may need to download fonts, scripts, and other resources that returning visitors can retrieve from cache.
Test both conditions where your tooling permits.
However, don’t confuse a warm-cache result with the experience of someone clicking an advertisement for the first time.
If the paid campaign primarily attracts new customers, cold-load performance deserves particular attention.
Step 5: Collect Real-User Performance Data
Laboratory tests are useful for diagnosing technical differences, but production campaigns should also collect real-user performance information.
When available, use CrUX field data and suitable real-user monitoring to examine mobile LCP, INP, and CLS.
Remember that CrUX uses a rolling 28-day dataset and requires sufficient eligible traffic.
New landing pages may not have page-level field data. In that situation, first-party real-user monitoring can help provide more immediate observations, provided the collection method and consent requirements are consistent.
Step 6: Repeat After Production Changes
A landing page can become slower after publication.
New tracking tags, embedded videos, marketing widgets, or personalisation scripts can change its performance.
Repeat the technical checks after significant changes so the comparison reflects the page customers actually use.
A builder that performs well only before the marketing team adds its required integrations may not be the best fit for the live workflow.
Recommended Landing Page Speed Testing Scorecard
Use a consistent worksheet to record the results.
Measurement
What to Record
Why It Matters
Mobile LCP
75th percentile field result where available
Main content loading
Mobile INP
75th percentile field result
Interaction responsiveness
Mobile CLS
75th percentile field result
Visual stability
Lighthouse diagnostics
Repeated controlled test results
Performance debugging
TTFB
Response timing under comparable conditions
Hosting and network investigation
Page weight
Downloaded resources
Identifies potentially expensive assets
JavaScript impact
Main-thread blocking and script activity
Explains interaction delays
Form readiness
Whether the form is usable and submits correctly
Conversion functionality
Tracking reliability
Whether required events and identifiers are preserved
Measurement validity
Maintenance time
Time to publish and maintain the finished page
Ongoing operational cost
A single weighted performance score can be convenient, but retaining the individual measurements makes the findings easier to investigate.
For example, two builders could have similar LCP values while producing very different experiences when someone interacts with the form.
The underlying metrics explain that difference more clearly than one overall number.
How to Measure Conversion Rates Without Misleading Yourself
Speed testing and conversion testing require different methods.
A laboratory test can compare how pages render under controlled conditions. A conversion experiment needs relevant visitors, consistent tracking, and an experimental design that reduces bias.
Simply publishing one page in Unbounce and another in Webflow, then comparing their conversion rates from different advertising campaigns, isn’t a reliable platform comparison.
The traffic sources, audience characteristics, messages, and bidding behaviour may differ.
Define the Conversion Before Running the Test
For a lead-generation campaign, the primary conversion might be a successfully submitted form.
For ecommerce, it could be a completed purchase. For a SaaS trial, it might be a completed account registration.
Choose one primary event and apply the same definition across the landing pages.
Don’t compare button clicks on one builder against successful form submissions on another.
A click can occur without a successful conversion.
Randomly Assign Comparable Traffic
Where practical, split comparable visitors between the test pages using a controlled allocation process.
For Google Ads, campaign experiments provide methods for dividing traffic and evaluating campaign changes.
However, the experimental setup must ensure that the intended difference is the landing page implementation, not the advertising offer, audience, or creative.
A builder’s native A/B testing is often designed to compare variants within that builder. It doesn’t automatically provide an unbiased method for comparing pages hosted on competing platforms.
A cross-builder test may therefore require an independent traffic-assignment method and consistent attribution across domains.
Keep Acquisition Conditions Consistent
Use the same offer, relevant audience, advertising message, and conversion objective.
If the pages use different domains, verify that the advertising platform permits the destination setup and that tracking identifiers are retained appropriately.
Google Ads has destination and display URL requirements that should not be bypassed through misleading redirects.
Also confirm that consent settings and tracking scripts operate consistently across the test.
Otherwise, a difference in reported conversions may reflect measurement rather than user behaviour.
Don’t Declare a Winner After a Few Conversions
A conversion difference observed after a small number of visitors may be random.
Before launching, define the primary metric, the smallest improvement worth detecting, the intended sample size, and the decision rule.
Run the experiment long enough to obtain an adequate sample and account for meaningful variation across days and traffic conditions.
Repeatedly checking the result and stopping as soon as one version appears ahead can produce misleading conclusions when the statistical method isn’t designed for continuous monitoring.
If the experiment doesn’t have enough traffic to distinguish a meaningful effect, report it as inconclusive.
Example: A Faster Page Doesn’t Automatically Win
Consider two hypothetical landing pages receiving equivalent paid traffic.
Metric
Page A
Page B
Visitors
2,000
2,000
Mobile LCP
2.2 seconds
3.1 seconds
Successful leads
100
120
Conversion rate
5.0%
6.0%
Allocated advertising cost
$4,000
$4,000
Cost per lead
$40.00
$33.33
All figures are illustrative and do not represent tested landing page builders.
Page A loads faster based on the example’s LCP measurement. However, Page B generates more recorded leads from the same number of visitors.
The conversion calculation is straightforward:
Page A conversion rate = 100 ÷ 2,000 × 100 = 5%
Page B conversion rate = 120 ÷ 2,000 × 100 = 6%
Page B shows a one-percentage-point absolute difference, equivalent to a 20% relative increase over Page A.
However, those observed totals alone don’t establish that the conversion difference is statistically reliable. Under a conventional two-sided comparison of independent conversion proportions, the example would not meet a typical 5% significance threshold.
That means a responsible report would describe the observed difference and the uncertainty rather than declaring Page B the proven winner.
The example also assumes the leads have equal quality.
If Page A produces fewer submissions but more qualified sales opportunities, the business outcome may favour Page A.
The Conversion Metrics That Matter More Than a Headline Rate
Landing page builders often advertise conversion improvements, but a headline uplift can hide important differences in what was measured.
A useful evaluation should include both the primary conversion event and the quality of the resulting business outcome.
Metric
Why It Matters
Successful conversion rate
Measures how often eligible visitors complete the intended action
Cost per lead
Connects advertising spend with recorded enquiries
Cost per qualified lead
Accounts for whether submissions meet business criteria
Lead-to-customer rate
Indicates the quality of acquired prospects
Revenue per visitor
Useful where revenue can be reliably attributed
Form abandonment
Helps identify friction within the lead-generation process
Conversion tracking completeness
Detects missing or duplicated events
Mobile conversion rate
Reveals whether mobile visitors encounter distinct problems
Why Lead Quality Matters
A simplified form might produce more submissions without improving the number of genuine prospects.
For example, removing qualification questions can lower friction, but it may also attract enquiries that the sales team cannot use.
Whether that’s a good trade-off depends on the business.
For lead-generation campaigns, the most useful measurement is often the cost of acquiring a qualified opportunity rather than the raw number of submissions.
Why Tracking Reliability Matters
A landing page may appear to outperform another simply because the tracking implementations differ.
One platform might count every form-button click, while another records only successful submissions.
Consent configurations can also affect which events are recorded, and cross-domain navigation may cause attribution gaps.
Before trusting the conversion report, manually test the complete path from advertisement to successful submission.
Verify that the expected events appear in your analytics and advertising systems and that the same user action isn’t counted multiple times.
Google’s GA4 key event documentation explains how to validate important actions through Realtime reporting and DebugView.
What Usually Slows Down Landing Pages?
Builder choice matters, but the page configuration frequently determines whether its performance remains acceptable.
Several common problems can affect pages built on almost any platform.
Oversized Hero Images and Videos
Large images and autoplaying video backgrounds can increase the amount of data visitors need to download.
This is particularly relevant to mobile visitors using slower networks.
Optimise media for its actual display size, use appropriate formats, and avoid downloading unnecessary assets before the main content becomes visible.
Too Many Third-Party Scripts
Analytics, advertising pixels, chat widgets, heatmaps, and personalisation systems can introduce additional JavaScript.
Not every script has the same performance impact, and some are necessary for measurement or business operations.
However, unnecessary tags should be removed, and important scripts should be configured according to the requirements of the platform and applicable consent controls.
A performance comparison should include the actual tag stack the campaign needs.
Delayed Fonts and Visual Shifts
Custom fonts can affect text rendering and visual stability if they’re not loaded appropriately.
Likewise, embedded forms, consent banners, or other elements can shift the page unexpectedly when dimensions aren’t reserved.
These problems can be identified through Core Web Vitals diagnostics and browser testing.
Excessive Animations and Interactions
Animations can help communicate a product or improve visual presentation.
However, elaborate transitions and interaction effects may add processing work or delay the appearance of important content.
The important question is whether the effect improves the visitor’s experience enough to justify its cost.
For a landing page focused on one conversion, unnecessary complexity can become an avoidable source of performance risk.
How to Evaluate the Real Cost of a Landing Page Builder
Subscription pricing matters, but it doesn’t represent the complete cost of running a paid campaign.
A platform may require additional subscriptions for A/B testing, heatmaps, analytics, or integrations.
Another may include those features but require more staff time to build and maintain pages.
The real cost should reflect the workflow needed to produce and maintain a performant, trackable landing page.
Compare Cost Per Finished Page
Consider the time required to create the page, configure mobile layouts, connect forms, validate tracking, and resolve technical issues.
A more expensive subscription may be economical when it reduces repetitive work across dozens of campaigns.
However, that advantage needs to be measured, not inferred from the number of features advertised.
Compare Cost Per Qualified Lead
Suppose a business spends $5,000 on advertising, $150 on allocated landing page software, and $250 on relevant maintenance during a reporting period.
If the campaign generates 100 qualified leads, the illustrative combined acquisition and landing-page operating cost is:
($5,000 + $150 + $250) ÷ 100 = $54 per qualified lead
This differs from advertising-only cost per lead because it includes selected landing page operating costs.
The calculation is only useful when the business applies consistent definitions and includes relevant expenses.
It should not be presented as a vendor benchmark or evidence that one builder caused the resulting conversions.
Account for Ongoing Maintenance
Landing pages often require updates after launch.
Offers change, tracking requirements evolve, and new campaigns need different messages or forms.
Measure how long it takes to implement those changes and confirm that the page still works correctly afterward.
A platform that is easy to publish but difficult to maintain may create unnecessary work over the life of the campaign.
How to Choose a Landing Page Builder Based on Your Campaign
There isn’t one platform that consistently delivers the fastest load time or highest conversion rate for every business.
A better choice starts with the structure of your campaign and the capabilities your team actually needs.
Campaign Situation
Builders Worth Evaluating
Primary Test
Dedicated paid lead-generation campaigns
Unbounce, Instapage, Leadpages
Form completion, tracking, mobile speed
Frequent A/B testing of offers and layouts
Unbounce, Instapage, Leadpages
Experiment setup and reliable conversion data
Complex branded campaign pages
Webflow, Framer
Responsive speed and interaction performance
Existing WordPress website
Elementor
Hosting, theme, caching, and plugin impact
Design-led campaigns
Framer, Webflow
Mobile LCP, CLS, and CTA usability
Limited technical resources
Leadpages, Unbounce
Time to publish and validate the complete funnel
These are workflow recommendations, not rankings based on a completed cross-platform benchmark.
If your existing builder already delivers strong Core Web Vitals and acceptable conversion performance, switching platforms may not provide a meaningful improvement.
Before migrating, identify whether the actual problem comes from the builder, page design, analytics configuration, traffic quality, or the offer.
The Mistakes That Make Landing Page Comparisons Misleading
Testing Different Templates Instead of Equivalent Pages
A lightweight template from one builder may outperform a visually elaborate example from another simply because it downloads fewer assets.
Use equivalent content and functionality when comparing technical performance.
Then run a separate production-realistic test using the features your team would actually deploy.
Comparing Speed Scores From Different Conditions
PageSpeed results vary according to test conditions.
Comparing one mobile run against a desktop result, or a laboratory score against field data, doesn’t establish a reliable difference.
Record the measurement environment and repeat tests where appropriate.
Ignoring Real-User Performance
A page may appear fast during synthetic testing but perform less consistently for visitors using different devices and networks.
Once sufficient data is available, inspect real-user Core Web Vitals and mobile-specific experiences.
If no URL-level field data exists, report that limitation instead of substituting unrelated origin-level measurements without explanation.
Comparing Conversion Rates From Different Campaigns
Different audiences, offers, and bidding conditions can explain conversion differences even when the landing pages are technically similar.
Use randomised experiments where practical and keep the acquisition conditions comparable.
If a controlled test isn’t possible, describe the comparison as observational rather than causal.
Trusting an Automated Winner Too Early
Some platforms use statistical models or automated traffic allocation to identify promising variations.
These systems can be useful, but their results should be interpreted using their actual methods, sample sizes, and assumptions.
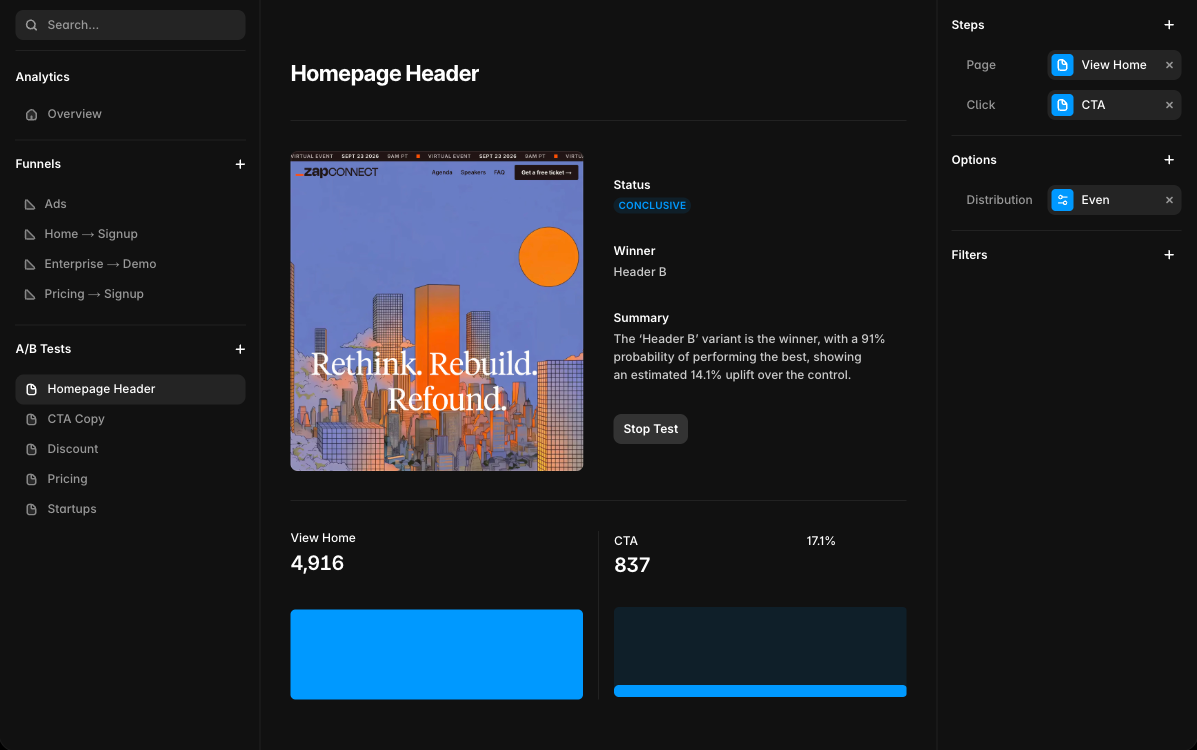
A dashboard declaring a winner doesn’t eliminate the need to understand what was measured and whether the result applies to the business outcome.
A landing page can increase submission volume while reducing lead quality.
Evaluate the complete conversion process when possible, including qualification and downstream sales outcomes.
The best landing page is the one that supports the business goal, not necessarily the one that produces the most button clicks.
A Practical Landing Page Evaluation Scorecard
For a balanced comparison, score the two major objectives separately.
Technical Performance
Criterion
Suggested Weight
Evaluation Method
Real-user mobile Core Web Vitals
40%
LCP, INP, and CLS
Repeatable mobile lab performance
25%
Controlled Lighthouse diagnostics
Tracking and form responsiveness
20%
Complete functional testing
Performance after integrations
15%
Retest with production scripts
Conversion and Operational Performance
Criterion
Suggested Weight
Evaluation Method
Primary conversion outcome
40%
Controlled experiment
Qualified lead or sales outcome
25%
CRM or transaction data
Experiment reliability
20%
Allocation, tracking, sample adequacy
Time and cost to maintain
15%
Staff time and operating cost
The weights are a suggested evaluation framework, not scores assigned to the six builders. Businesses should adjust them according to campaign goals, traffic volume, and conversion requirements.
The separation matters because technical quality and conversion outcomes answer different questions.
A platform can pass a technical benchmark without proving that it improves sales. Conversely, an observed conversion advantage shouldn’t excuse severe accessibility or responsiveness problems.
Final Verdict: Judge the Published Page, Not the Builder’s Marketing
Landing page builders have become capable enough that most established products can support a functional paid advertising page.
The real differences emerge when you examine how easily teams can maintain performance, validate conversion tracking, and run dependable experiments under production conditions.
Unbounce, Instapage, and Leadpages are worth evaluating when campaign-specific landing pages and integrated conversion testing are the primary requirements.
Webflow and Framer offer greater flexibility for visually complex or branded experiences, while WordPress with Elementor provides more control over hosting and the surrounding technical environment.
However, none should be declared the fastest or highest-converting platform without processing equivalent pages through the same technical and conversion evaluation.
Start by defining the campaign goal and building comparable pages. Measure individual Core Web Vitals, inspect the actual production scripts, and test the conversion process before allocating significant advertising traffic.
Then evaluate the resulting business outcomes using an appropriate experiment.
The landing page builder worth paying for is the one that consistently delivers a usable page, reliable measurement, and valuable conversions without unnecessary operational work.
Frequently Asked Questions
What Is the Best Landing Page Builder for Paid Advertising?
The best option depends on the campaign. Unbounce, Instapage, and Leadpages offer dedicated landing page workflows with experimentation capabilities. Webflow and Framer provide broader design flexibility, while WordPress with Elementor offers more hosting control. A reliable decision requires comparing equivalent pages and the complete conversion workflow.
Which Landing Page Builder Is the Fastest?
There isn’t a defensible universal winner without controlled testing. Load speed depends on the published page’s assets, scripts, hosting configuration, and implementation. Compare equivalent pages using repeated laboratory tests and real-user Core Web Vitals when sufficient data is available.
What Is a Good Landing Page Load Speed?
Google recommends a Largest Contentful Paint of 2.5 seconds or less, an Interaction to Next Paint of 200 milliseconds or less, and a Cumulative Layout Shift of 0.1 or less at the 75th percentile of real-user experiences. These are user-experience thresholds, not guaranteed conversion-rate targets.
Does a Faster Landing Page Always Convert Better?
No. Faster loading can improve the experience, but conversion rates also depend on the offer, audience, messaging, trust, form design, and tracking configuration. A proper conversion experiment is needed to establish whether an observed difference is meaningful.
Is a 100 PageSpeed Insights Score Necessary?
No. The Lighthouse performance score is a laboratory diagnostic, not a direct conversion measurement. A page can provide a good real-user experience without scoring 100. Focus on meaningful technical issues and business outcomes rather than maximising the synthetic score alone.
Can I Compare Landing Page Builders Using A/B Testing?
Yes, but the experiment must be designed carefully. Visitors should be assigned comparably, and the pages should use the same offer, conversion definition, and attribution configuration. Native A/B testing within one builder doesn’t automatically create a controlled comparison across different builders.
Do Landing Page Builders Affect Google Ads Quality Score?
Landing page experience contributes to Google’s assessment of ad quality, alongside factors such as relevance. However, the displayed 1–10 Quality Score is a diagnostic measurement rather than a direct auction input. Improving a landing page doesn’t guarantee a specific Quality Score change or lower advertising costs.
Is WordPress With Elementor Slower Than Dedicated Landing Page Builders?
Not necessarily. Elementor performance depends on hosting, theme choice, active plugins, caching, media assets, and page configuration. A well-optimised WordPress implementation may perform differently from one with unnecessary extensions or poor hosting. Controlled testing is required before drawing conclusions.
How Many Visitors Do I Need for a Landing Page A/B Test?
There is no universal sample size. The required traffic depends on the baseline conversion rate, the minimum detectable effect, the statistical method, and the level of confidence or power required. A test with insufficient data should be reported as inconclusive rather than declaring a winner based on a small difference.
Should I Choose a Builder Based on Conversion Rate Claims?
Vendor conversion claims can provide context, but they may come from selected campaigns, different audiences, or historical studies. They don’t establish how the product will perform on your landing page. Evaluate the vendor’s methodology and prioritise results from a properly designed test of your own campaign.
This article evaluates documented landing page builder capabilities and presents a repeatable methodology for technical and conversion testing. It does not claim original cross-platform benchmark results or statistically validated conversion winners.
Disclosure: DigitalMarketingTools.ai is sponsored by Digimetrics.ai, which is developed by MediaOne. This article does not include a ranked Digimetrics recommendation or sponsored product performance claim.
About the author
Tom Koh
Tom is the CEO of MediaOne, a leading digital marketing agency. He is a business-experienced SEO consultant as well as a Google Gold Search Expert serving the international community. He has consulted for MNCs like Canon, Maybank, Capitaland, SingTel, ST Engineering, WWF, Cambridge University, as well as Government organisations like Enterprise Singapore, Ministry of Law, National Galleries, NTUC, e2i, SingHealth. His articles are published and referenced in CNA, Straits Times, MoneyFM, Financial Times, Yahoo! Finance, Hubspot, Zendesk, CIO Advisor. Under his stewardship, MediaOne has won dozens of prestigious digital marketing awards.
Your website has 150 published articles. Some attract consistent organic traffic, others haven’t generated a meaningful visit in months, and several cover nearly identical…
Writing a good advertisement sounds simple until you have to create 15 different headlines, stay within character limits, communicate your product’s benefits, and make…
Verifiability matters more than speed when publishing AI-generated content. An AI content generator turns a short brief into draft copy, and its usefulness depends…